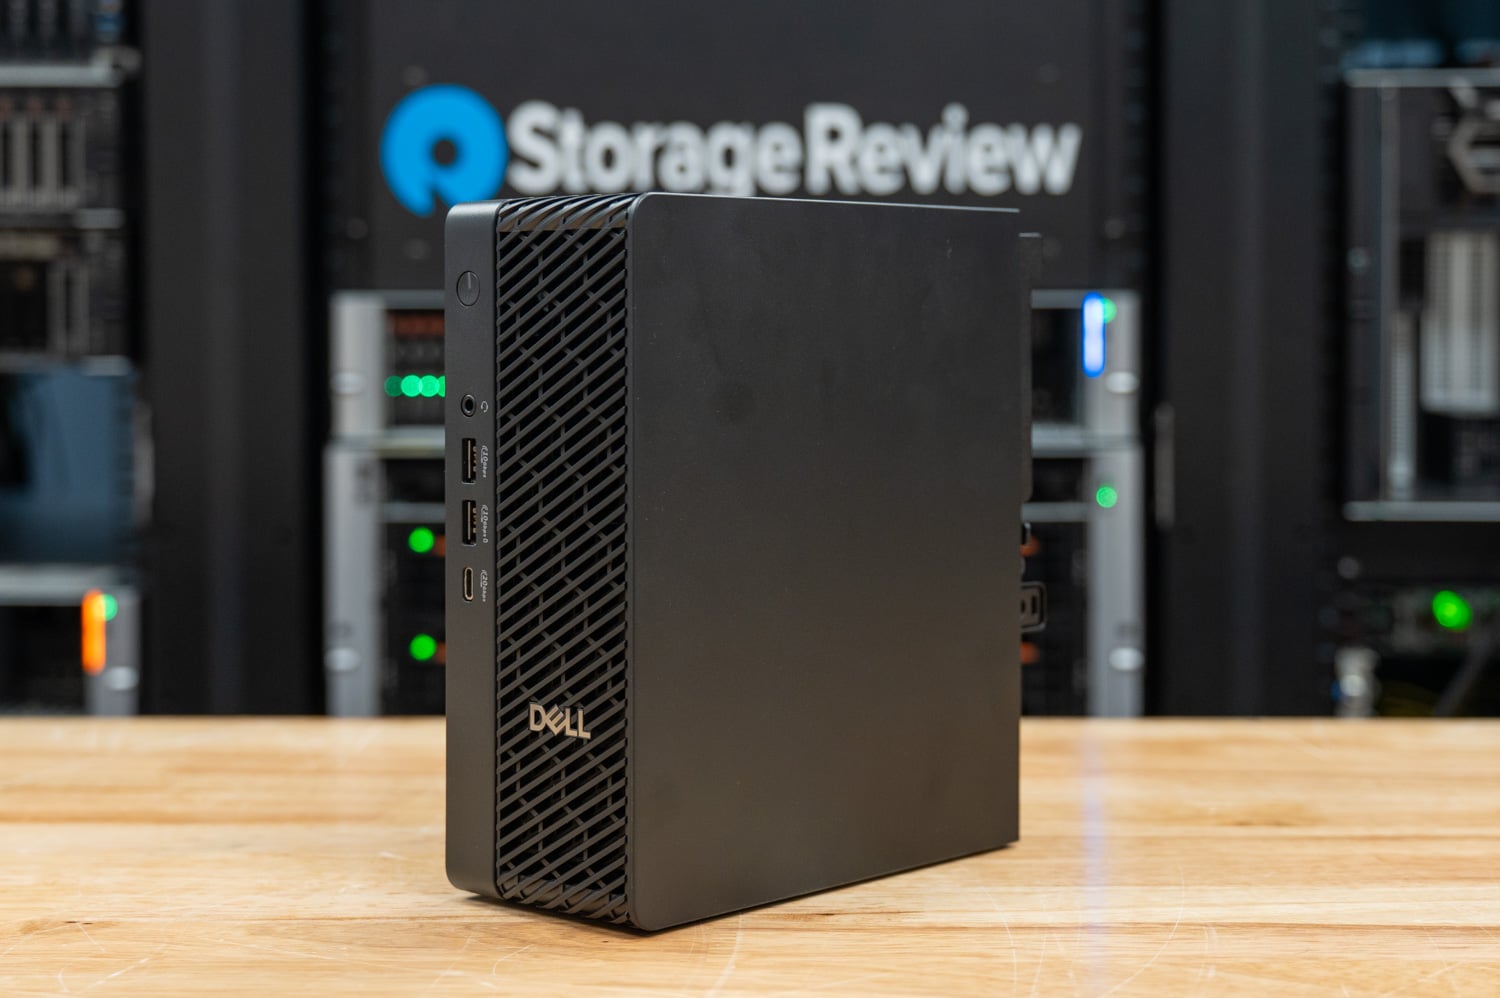
The Dell Pro Max Micro (FCM2250) fits a 24-core Intel Core Ultra 9 285, a 24GB NVIDIA RTX PRO 4000 Blackwell SFF Edition, and 96GB of DDR5-6400 into a chassis Dell lists at about 2.9 liters. It is the smallest workstation in the Pro Max desktop line, and it carries the vPro Enterprise management and security features of Dell’s commercial desktops. We tested it on Linux against Dell’s Pro Precision 9 T2 tower, the Corsair FlexPrime V20C with its 32GB Intel Arc Pro B70, and two desktops built around 128GB of unified memory, to measure what a discrete RTX PRO card in this footprint delivers for local AI.
Key Takeaways
- CUDA put the Micro ahead of every system outside Dell’s line in Ollama throughput and image generation. It ingested 268.2 RAG passages per second against 211.4 on the Dell Pro Max with GB10, 95.5 on the AMD Ryzen AI Halo, and 87.5 on the Corsair FlexPrime V20C, and it produced 11.46 FLUX.2 klein images per minute against 9.96, 3.86, and 4.26.
- 24GB of graphics memory sets the model ceiling. Qwen3.8 27B needs 30GB for serving and Qwen-Image 20B needs 28GB, so neither loaded on the RTX PRO 4000 SFF, while the 32GB Arc Pro B70, the two unified-memory systems, and the T2 ran both.
- Dell’s Pro Precision 9 T2 shows what the next step up the line adds. With a 96GB RTX PRO 6000 Max-Q, the T2 served Ministral 3 8B at 167.3 tokens per second for one request against 52.0 on the Micro, 63.7 on the V20C, 37.0 on the GB10, and 30.6 on the Halo, and it ran the 27B model the Micro could not load.
- The 24-core CPU runs hot in this chassis and trails a tower. The Core Ultra 9 285 peaked between 98C and 105C in every all-core test, scored 164.0 GIPS in 7-Zip against 199.6 on the V20C, and compiled the Linux kernel in 918 seconds against 639.
- The Gen5 SSD is the fastest single drive in the comparison. One 1TB Sandisk SN8050S read at 9,433MB/s, peaked at 2.08 million IOPS in 4K random read, and brought a 12.8GB model to its first token in 5.11 seconds.
- Our review configuration lists at $11,999 on Dell.com. Dell prices the Pro Max Micro from $1,449, and our unit lists at three times the $3,999.99 Corsair FlexPrime V20C and AMD Ryzen AI Halo and about 1.6 times a $7,521 Dell Pro Max with GB10.
Where the Pro Max Micro Sits
Dell positions the Pro Max Micro as its ultra-compact commercial workstation, the smallest of the Pro Max desktops below the SFF and tower models. Dell built it for organizations that need workstation performance, discrete professional graphics, and ISV certification in tight spaces, and it supports mounting on an all-in-one stand, on a shelf behind a display, on a wall, or under a desk. The platform takes Core Ultra 5, 7, and 9 processors, which Dell runs at 85W with an enhanced thermal solution, above the chips’ 65W rating.
Graphics options top out at the card in our unit, the 70W RTX PRO 4000 Blackwell SFF Edition with 24GB of GDDR7 ECC memory. System memory runs to 96GB of DDR5-6400 on two CSODIMMs, as tested, or to 64GB with ECC modules and Dell’s Reliable Memory Technology Pro, which maps out bad memory regions at the BIOS level. The system supports up to 8TB of storage across two M.2 2280 slots, one PCIe Gen5 and one Gen4. Our unit includes two 1TB Gen5 self-encrypting drives configured by Dell as a RAID 0 volume.
Above the Micro, Dell’s workstation towers add full-size graphics cards and more memory channels. The Dell Pro Precision 9 T2 in this comparison is the smallest tower in the Xeon-based Pro Precision 9 line, here with the 24-core Xeon 658X, a 96GB RTX PRO 6000 Blackwell Max-Q, and four channels of DDR5-6400, and the Dell Pro Precision 9 T4 above it takes up to four GPUs, depending on the card. Including the T2 shows how far results scale between Dell’s smallest workstation and a single-GPU tower.
Dell lists the Pro Max Micro from $1,449, and the configuration we tested comes to $11,999 for a single unit on Dell.com. That figure includes the Core Ultra 9 285, the RTX PRO 4000 SFF, 96GB of memory, the two Gen5 SSDs, a 5GbE module, Wi-Fi 7, and three years of ProSupport with on-site service in place of the one-year base warranty. Dell sells most of these systems through account teams and partners, where volume pricing applies.
Build and Design
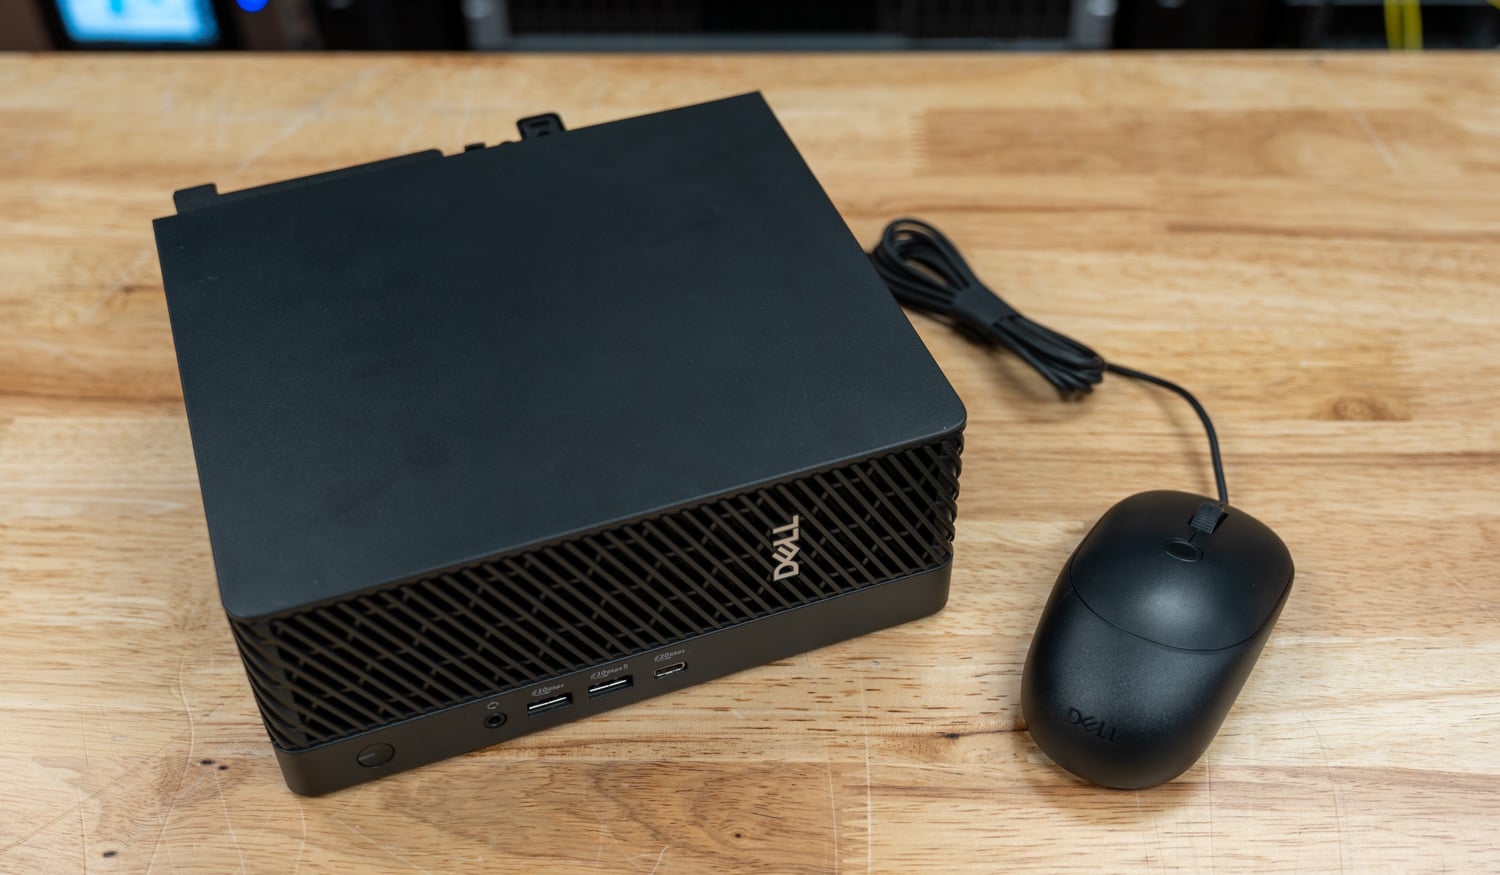
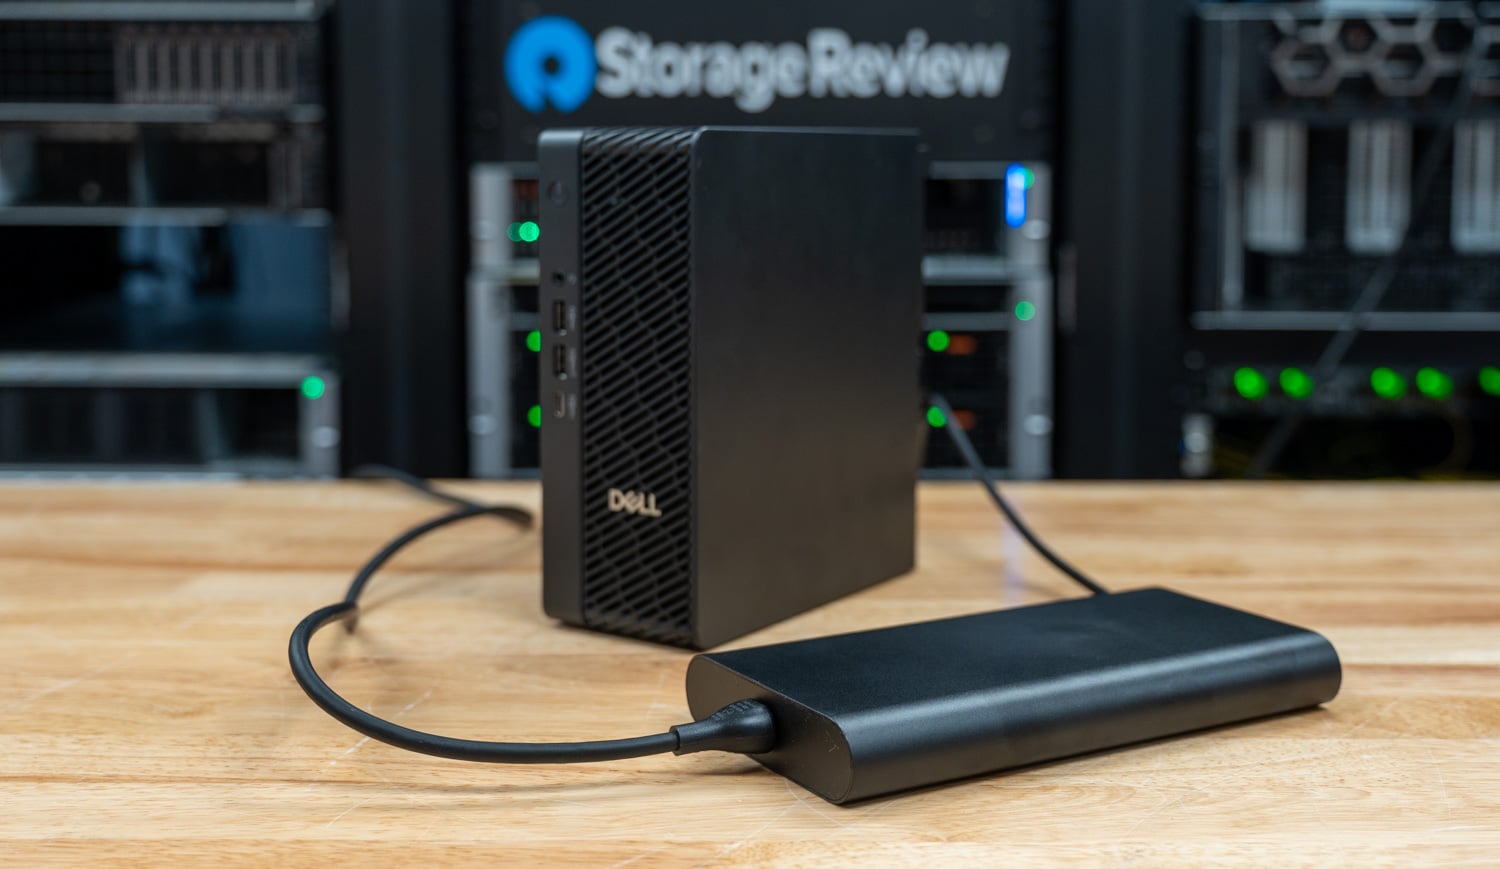
The chassis is black resin and measures 206 x 79.3 x 178mm (8.11 x 3.12 x 7.00 in), weighing between 2.34kg and 2.54kg depending on configuration. Dell says the design carries over from the previous generation so that existing mounts and fleet accessories fit. Power comes from an external 280W adapter with a 7.4mm barrel connector. Materials include 46.4 percent post-consumer recycled plastic, and the system is ENERGY STAR qualified and registered EPEAT Gold with Climate+.
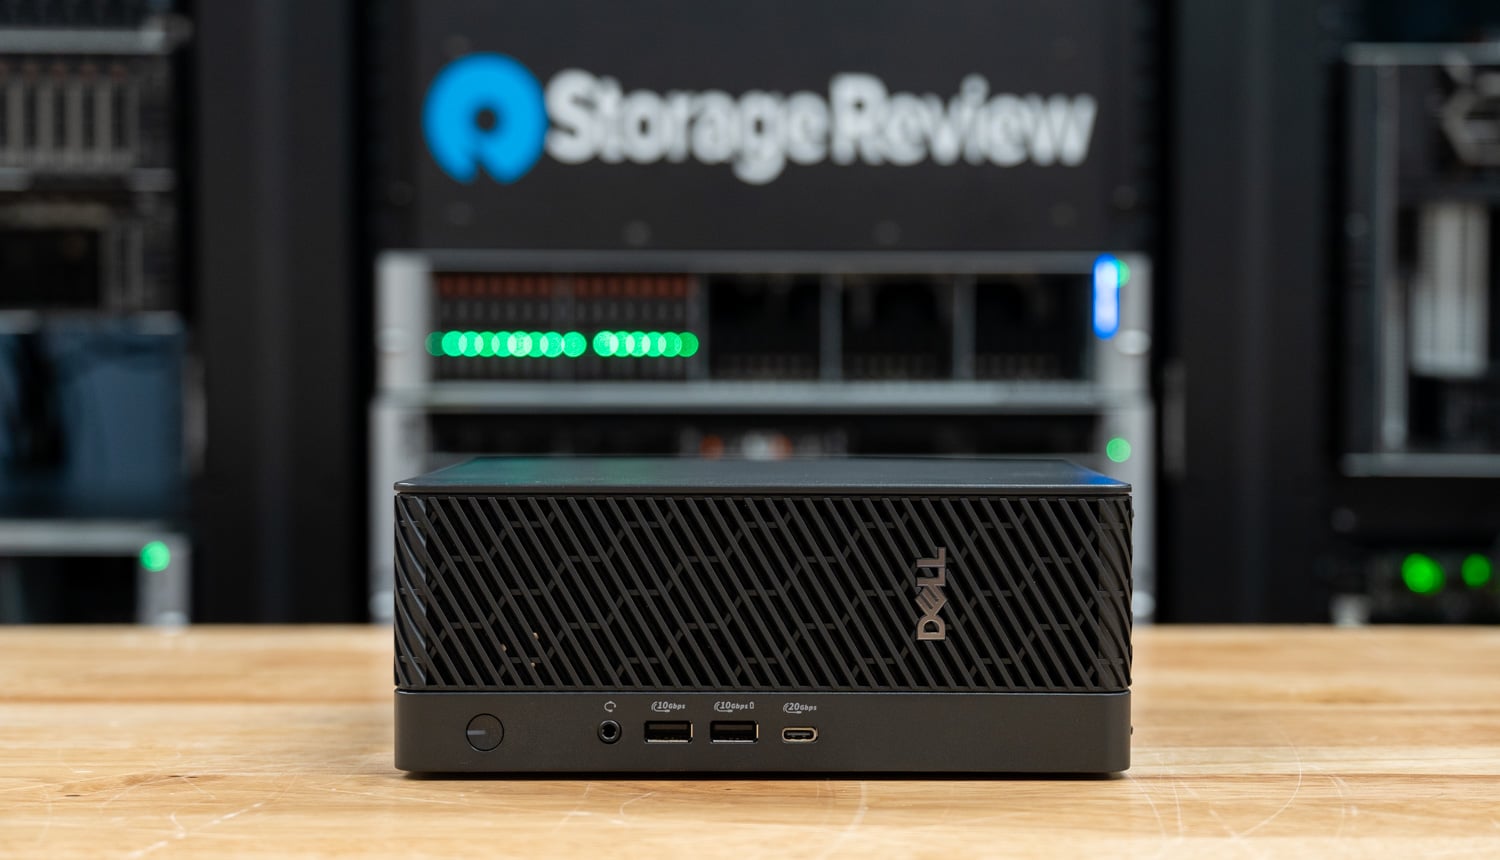
The front panel has a 20Gbps USB Type-C port, two 10Gbps USB Type-A ports (one with PowerShare), and a headset jack. Around the back are a 10Gbps USB Type-C port, two 10Gbps and two 5Gbps USB Type-A ports, three DisplayPort 1.4a outputs from the integrated graphics, and a 1GbE RJ45 port. The RTX PRO 4000 SFF adds four mini-DisplayPort outputs, which brings the total to seven display connections, and Dell includes four adapters to full-size DisplayPort.
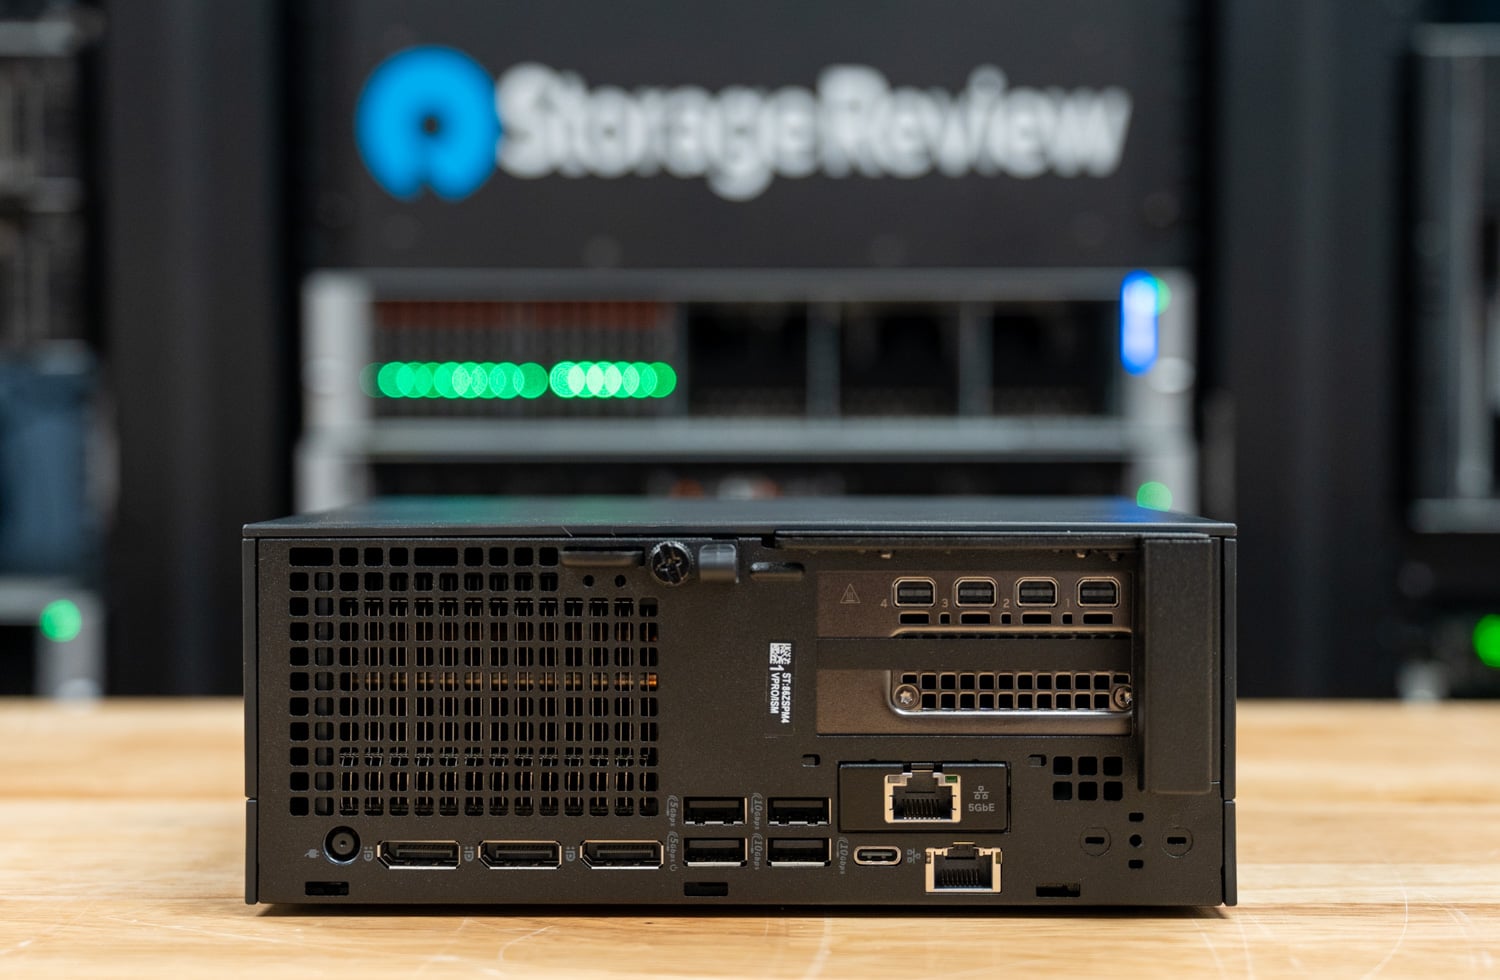
A modular port on the rear accepts one of nine options, and ours holds a 5GbE LAN module. The other choices are VGA, HDMI 2.1, DisplayPort 2.1, serial with PS/2, USB Type-C with DisplayPort Alt Mode, two USB Type-A ports, Thunderbolt 4 with USB Type-C, and 5G optical fiber. Dell also lists 2.5GbE and dual-port 10GbE networking for the platform, and our unit’s wireless is Intel’s Wi-Fi 7 BE200 with Bluetooth 5.4.
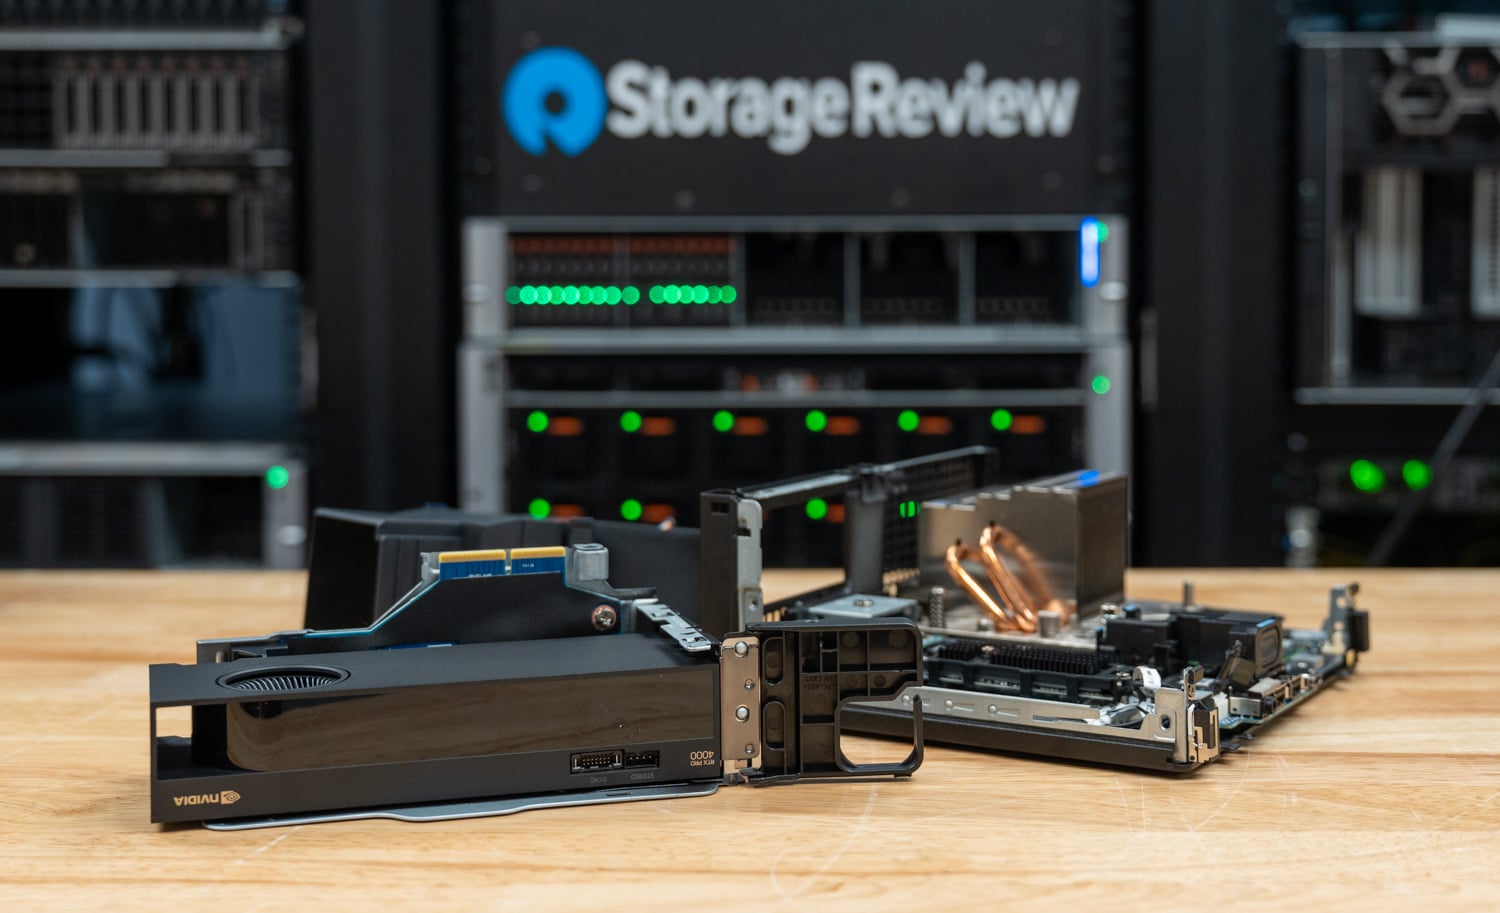
Inside, Dell lists two PCIe Gen4 slots with x8 connectors, one wired x8 for the graphics card and one wired x1, plus an M.2 2230 slot for the wireless card. Both SSDs sit under a shared heatsink with thermal pads, and the memory is socketed on two CSODIMM slots. The chassis is largely tool-less, with memory and storage that the owner can replace.
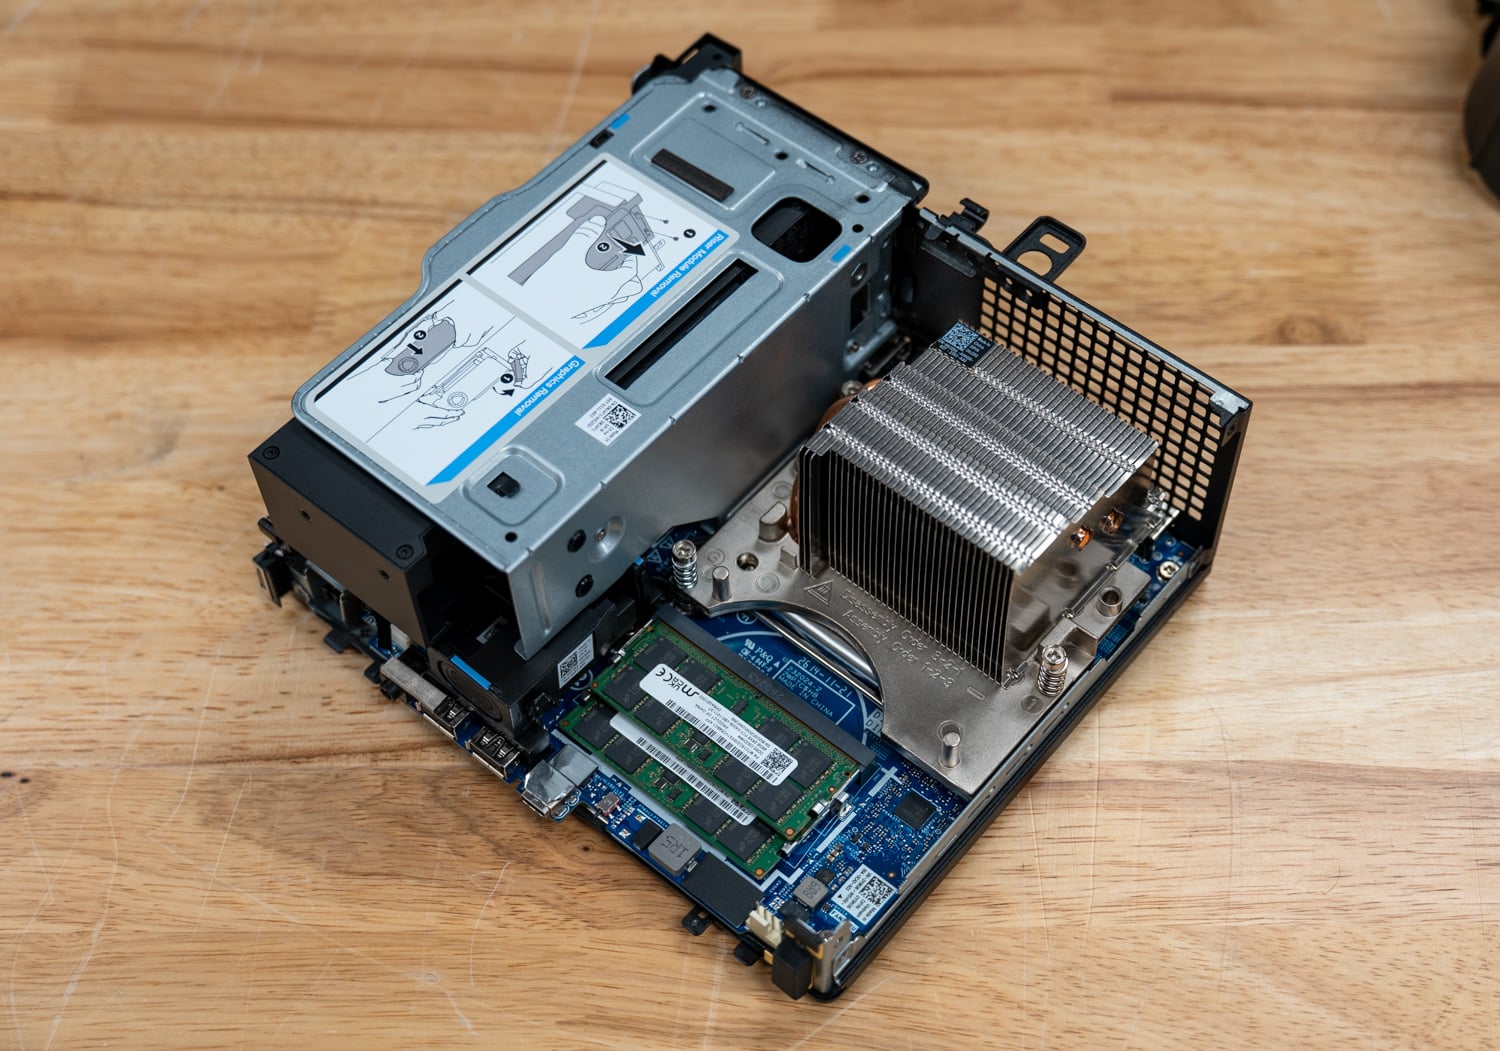
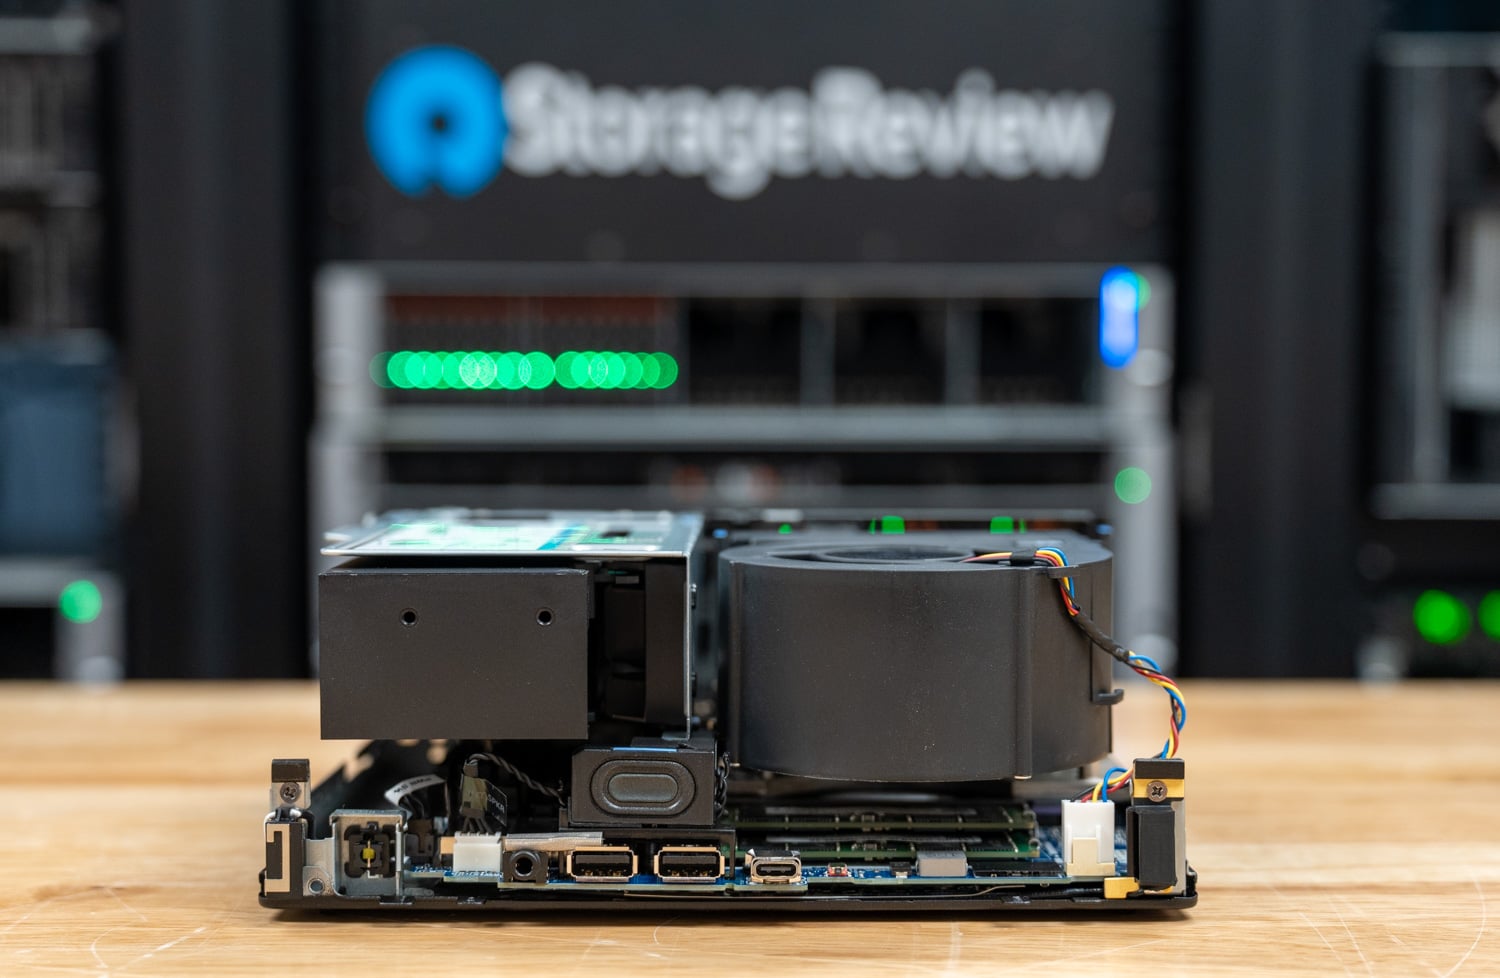
In the lab, the cover came off after one screw. With it off, the CPU fan shroud releases with finger clips, exposing the two memory slots, and the PCIe riser comes out after two screws, giving access to both expansion slots. Our lab found the system simple to service overall.
Security and management follow Dell’s commercial desktop template, with SafeBIOS off-host firmware verification, SafeID credential protection, Secured Component Verification, Opal 2.0 self-encrypting drives, a Kensington slot, and a padlock ring. The system is configured with Intel vPro Enterprise and works with Dell’s Client Command Suite. Dell ships it with Windows 11 Pro, and the lab replaced that image with Ubuntu for testing.
Our unit arrived with Dell’s Pro 5 Wired Fingerprint ESS Mouse (MS526C), a $44.99 accessory with a fingerprint reader that provides one-touch sign-in through Windows Hello. It connects over USB Type-A on a 5.91ft cable, tracks at 1,600 dpi by default and up to 6,000, and weighs 2.57oz. Dell lists support for Windows 10 and Windows 11, so the reader sat outside our Linux testing. But generally, it’s a nice add for boxes like this that might be mounted or otherwise inconvenient to reach. A wireless version of this mouse would be even more useful in those cases.
Dell Pro Max Micro Specifications
| Specification | Dell Pro Max Micro |
|---|---|
| Platform | |
| Model | Dell Pro Max Micro (FCM2250) |
| Processor | Intel Core Ultra 9 285, 24 cores (8 P-cores, 16 E-cores), 24 threads, up to 5.6GHz 36MB cache, dedicated NPU 65W, run at 85W (Dell) |
| Graphics | NVIDIA RTX PRO 4000 Blackwell SFF Edition, 70W 24GB GDDR7 ECC |
| Memory | 96GB (2x 48GB) DDR5-6400 CSODIMM, non-ECC Up to 64GB DDR5 ECC optional |
| Storage | 2x 1TB M.2 2280 PCIe Gen5 SED, RAID 0 as shipped Sandisk SN8050S as tested Up to 8TB across two M.2 slots (one Gen5, one Gen4) |
| Expansion | 2x PCIe Gen4 x8 slots (wired x8 and x1) 1x M.2 2230 (wireless) |
| Operating System | Windows 11 Pro as shipped Ubuntu 26.04.1 LTS as tested |
| Connectivity | |
| Front Ports | 1x USB Type-C 20Gbps 2x USB Type-A 10Gbps (one with PowerShare) 1x headset jack |
| Rear Ports | 1x USB Type-C 10Gbps 2x USB Type-A 10Gbps 2x USB Type-A 5Gbps 1x RJ45 1GbE 1x optional module port (5GbE as tested) |
| Display Outputs | 4x mini-DisplayPort (RTX PRO 4000 SFF) 3x DisplayPort 1.4a (integrated) |
| Wireless | Intel Wi-Fi 7 BE200 (2×2), Bluetooth 5.4 |
| Audio | Internal speaker, Realtek ALC3204 codec Front headset combo port |
| Security and Management | |
| Security | Dell SafeBIOS, SafeID, Secured Component Verification Opal 2.0 SED, Kensington slot, padlock ring |
| Management | Intel vPro Enterprise Dell Client Command Suite |
| Physical and Support | |
| Dimensions (H x W x D) | 206 x 79.3 x 178mm (8.11 x 3.12 x 7.00in), about 2.9L |
| Weight | 2.34kg to 2.54kg (5.15lb to 5.59lb) |
| Power | 280W AC adapter |
| Warranty | 3 years ProSupport with on-site service as configured 1 year base |
| Price | $1,449 base $11,999 as tested (Dell.com) |
Test Setup and Methodology
Dell ships the Pro Max Micro with Windows 11 Pro. Because we test higher-end workstations on Linux with a current kernel, the lab installed Ubuntu 26.04.1 LTS with the 7.0 kernel on one of the two 1TB SSDs, so the factory RAID 0 volume is not part of these results. The system ran BIOS 1.19.1 on the default power profile with NVIDIA driver 595.99.02, and the suite measured 23.9GB of GPU-usable memory on the RTX PRO 4000 SFF.
Results come from three in-house suites, starting with sr-client_linux 0.1, the Linux build of our client suite, which covers local AI, content creation, and storage. Each figure is the median of repeated passes. Our benchmark harness wraps Phoronix Test Suite workloads and y-cruncher, and our server suite runs ClickBench, OpenFOAM, STREAM, and Valkey. MLPerf Client’s Linux release ships Intel OpenVINO configurations only, so it has no results on the NVIDIA card, and our fine-tuning test was not part of this run.
The comparison set starts inside Dell’s portfolio and adds three other ways to buy local AI hardware. The Pro Precision 9 T2 is a tower with the 24-core Xeon 658X, a 96GB RTX PRO 6000 Blackwell Max-Q, and 128GB of DDR5-6400. The Corsair FlexPrime V20C is a micro-ATX tower with the 24-core Core Ultra 7 270K Plus, a 32GB Intel Arc Pro B70, and 64GB of DDR5-6400. The Dell Pro Max with GB10 runs NVIDIA’s 20-core GB10 with 128GB of unified memory on NVIDIA’s Ubuntu 24.04 image, and the AMD Ryzen AI Halo runs the 16-core Ryzen AI Max+ 395 with 128GB of unified LPDDR5X on AMD’s Linux developer image.
The Halo ran sr-client_linux 0.1, harness v3.6, and server suite r5.28 on AMD’s developer image. The GB10 ran earlier releases of the harness and server suite with the same application versions, and the three operating systems carry different compilers, which affects source-built tests such as the kernel compile. The Micro, the T2, and the V20C share Ubuntu 26.04.1 and form the tightest group.
Software paths differ by GPU vendor and shape the AI results. The Micro, T2, and GB10 used CUDA throughout llama.cpp, Ollama, and stable-diffusion.cpp. The Halo used AMD’s ROCm in all three. On the V20C, llama.cpp ran on its SYCL backend, and Ollama and stable-diffusion.cpp ran through Vulkan because Ollama’s native path placed none of the model on the Arc card. That difference accounts for much of the Micro’s lead in the Ollama and image tests that follow.
| Configuration | CPU | Memory | GPU | Boot Drive | Operating System |
|---|---|---|---|---|---|
| Dell Pro Max Micro (FCM2250) | Core Ultra 9 285, 24 cores | 96GB DDR5-6400 (2x 48GB) | NVIDIA RTX PRO 4000 Blackwell SFF, 23.9GB usable | 1TB Sandisk SN8050S, PCIe Gen5 | Ubuntu 26.04.1 LTS, kernel 7.0 |
| Dell Pro Precision 9 T2 (PW9T2260) | Xeon 658X, 24 cores | 128GB DDR5-6400 (4x 32GB) | NVIDIA RTX PRO 6000 Blackwell Max-Q, 95.6GB usable | Samsung PM9E1 Gen5, 2TB drives in a striped array | Ubuntu 26.04.1 LTS, kernel 7.0 |
| Corsair FlexPrime V20C | Core Ultra 7 270K Plus, 24 cores | 64GB DDR5-6400 (4x 16GB) | Intel Arc Pro B70, 31.9GB usable | 1TB XPG MARS 970 PLUS, PCIe Gen5 | Ubuntu 26.04.1 LTS, kernel 7.0 |
| Dell Pro Max with GB10 (FCM1253) | NVIDIA GB10, 20 cores | 128GB LPDDR5X-8533, unified | NVIDIA GB10, 121.6GB usable | 4TB PCIe Gen4 | Ubuntu 24.04.5 LTS, NVIDIA kernel 7.0 |
| AMD Ryzen AI Halo | Ryzen AI Max+ 395, 16 cores | 128GB LPDDR5X-8000, unified | Radeon 8060S (integrated), 95.5GB usable | 2TB Micron 4600, PCIe Gen4 link | AMD Linux developer image, kernel 7.2 |
Local AI Performance
The RTX PRO 4000 SFF gives the Micro 24GB of dedicated graphics memory, and the suite measured 23.9GB of it as usable. That is enough for the 20B agent model and the Ministral serving models in our lineup. The V20C’s 32GB card also clears the 30GB that the 27B serving model needs, and the T2’s 96GB card and the 128GB unified-memory systems qualify for larger model tiers that the Micro cannot load.
LLM Serving
| llama.cpp server (higher is better unless noted) | Dell Pro Max Micro (Ultra 9 285, RTX PRO 4000 SFF 24GB) | Dell Pro Precision 9 T2 (Xeon 658X, RTX PRO 6000 Max-Q 96GB) | Corsair FlexPrime V20C (Ultra 7 270K Plus, Arc Pro B70 32GB) | Dell Pro Max with GB10 (128GB unified) | AMD Ryzen AI Halo (Ryzen AI Max+ 395, 128GB unified) |
|---|---|---|---|---|---|
| Ministral 3 3B, 1 request (tokens/s) | 80.7 | 243.8 | 84.9 | 53.2 | 43.0 |
| Ministral 3 3B, 4 requests (tokens/s) | 201.5 | 602.6 | 213.3 | 139.8 | 105.1 |
| Ministral 3 3B, 1 request, time to first token (ms, lower is better) | 666 | 197 | 590 | 572 | 1,659 |
| Ministral 3 8B, 1 request (tokens/s) | 52.0 | 167.3 | 63.7 | 37.0 | 30.6 |
| Ministral 3 8B, 4 requests (tokens/s) | 108.9 | 384.9 | 141.8 | 97.2 | 66.6 |
| Ministral 3 8B, 1 request, time to first token (ms, lower is better) | 1,477 | 427 | 1,362 | 1,398 | 4,602 |
| Qwen3.8 27B, 1 request (tokens/s) | Did not fit | 53.8 | 19.8 | 11.2 | 9.1 |
| Qwen3.8 27B, 4 requests (tokens/s) | Did not fit | 113.5 | 33.5 | 27.1 | 18.4 |
| Qwen3.8 27B, 8 requests (tokens/s) | Did not fit | 155.8 | 35.4 | 35.6 | 20.1 |
| Qwen3.8 27B, 1 request, time to first token (ms, lower is better) | Did not fit | 2,771 | 9,005 | 9,207 | 24,024 |
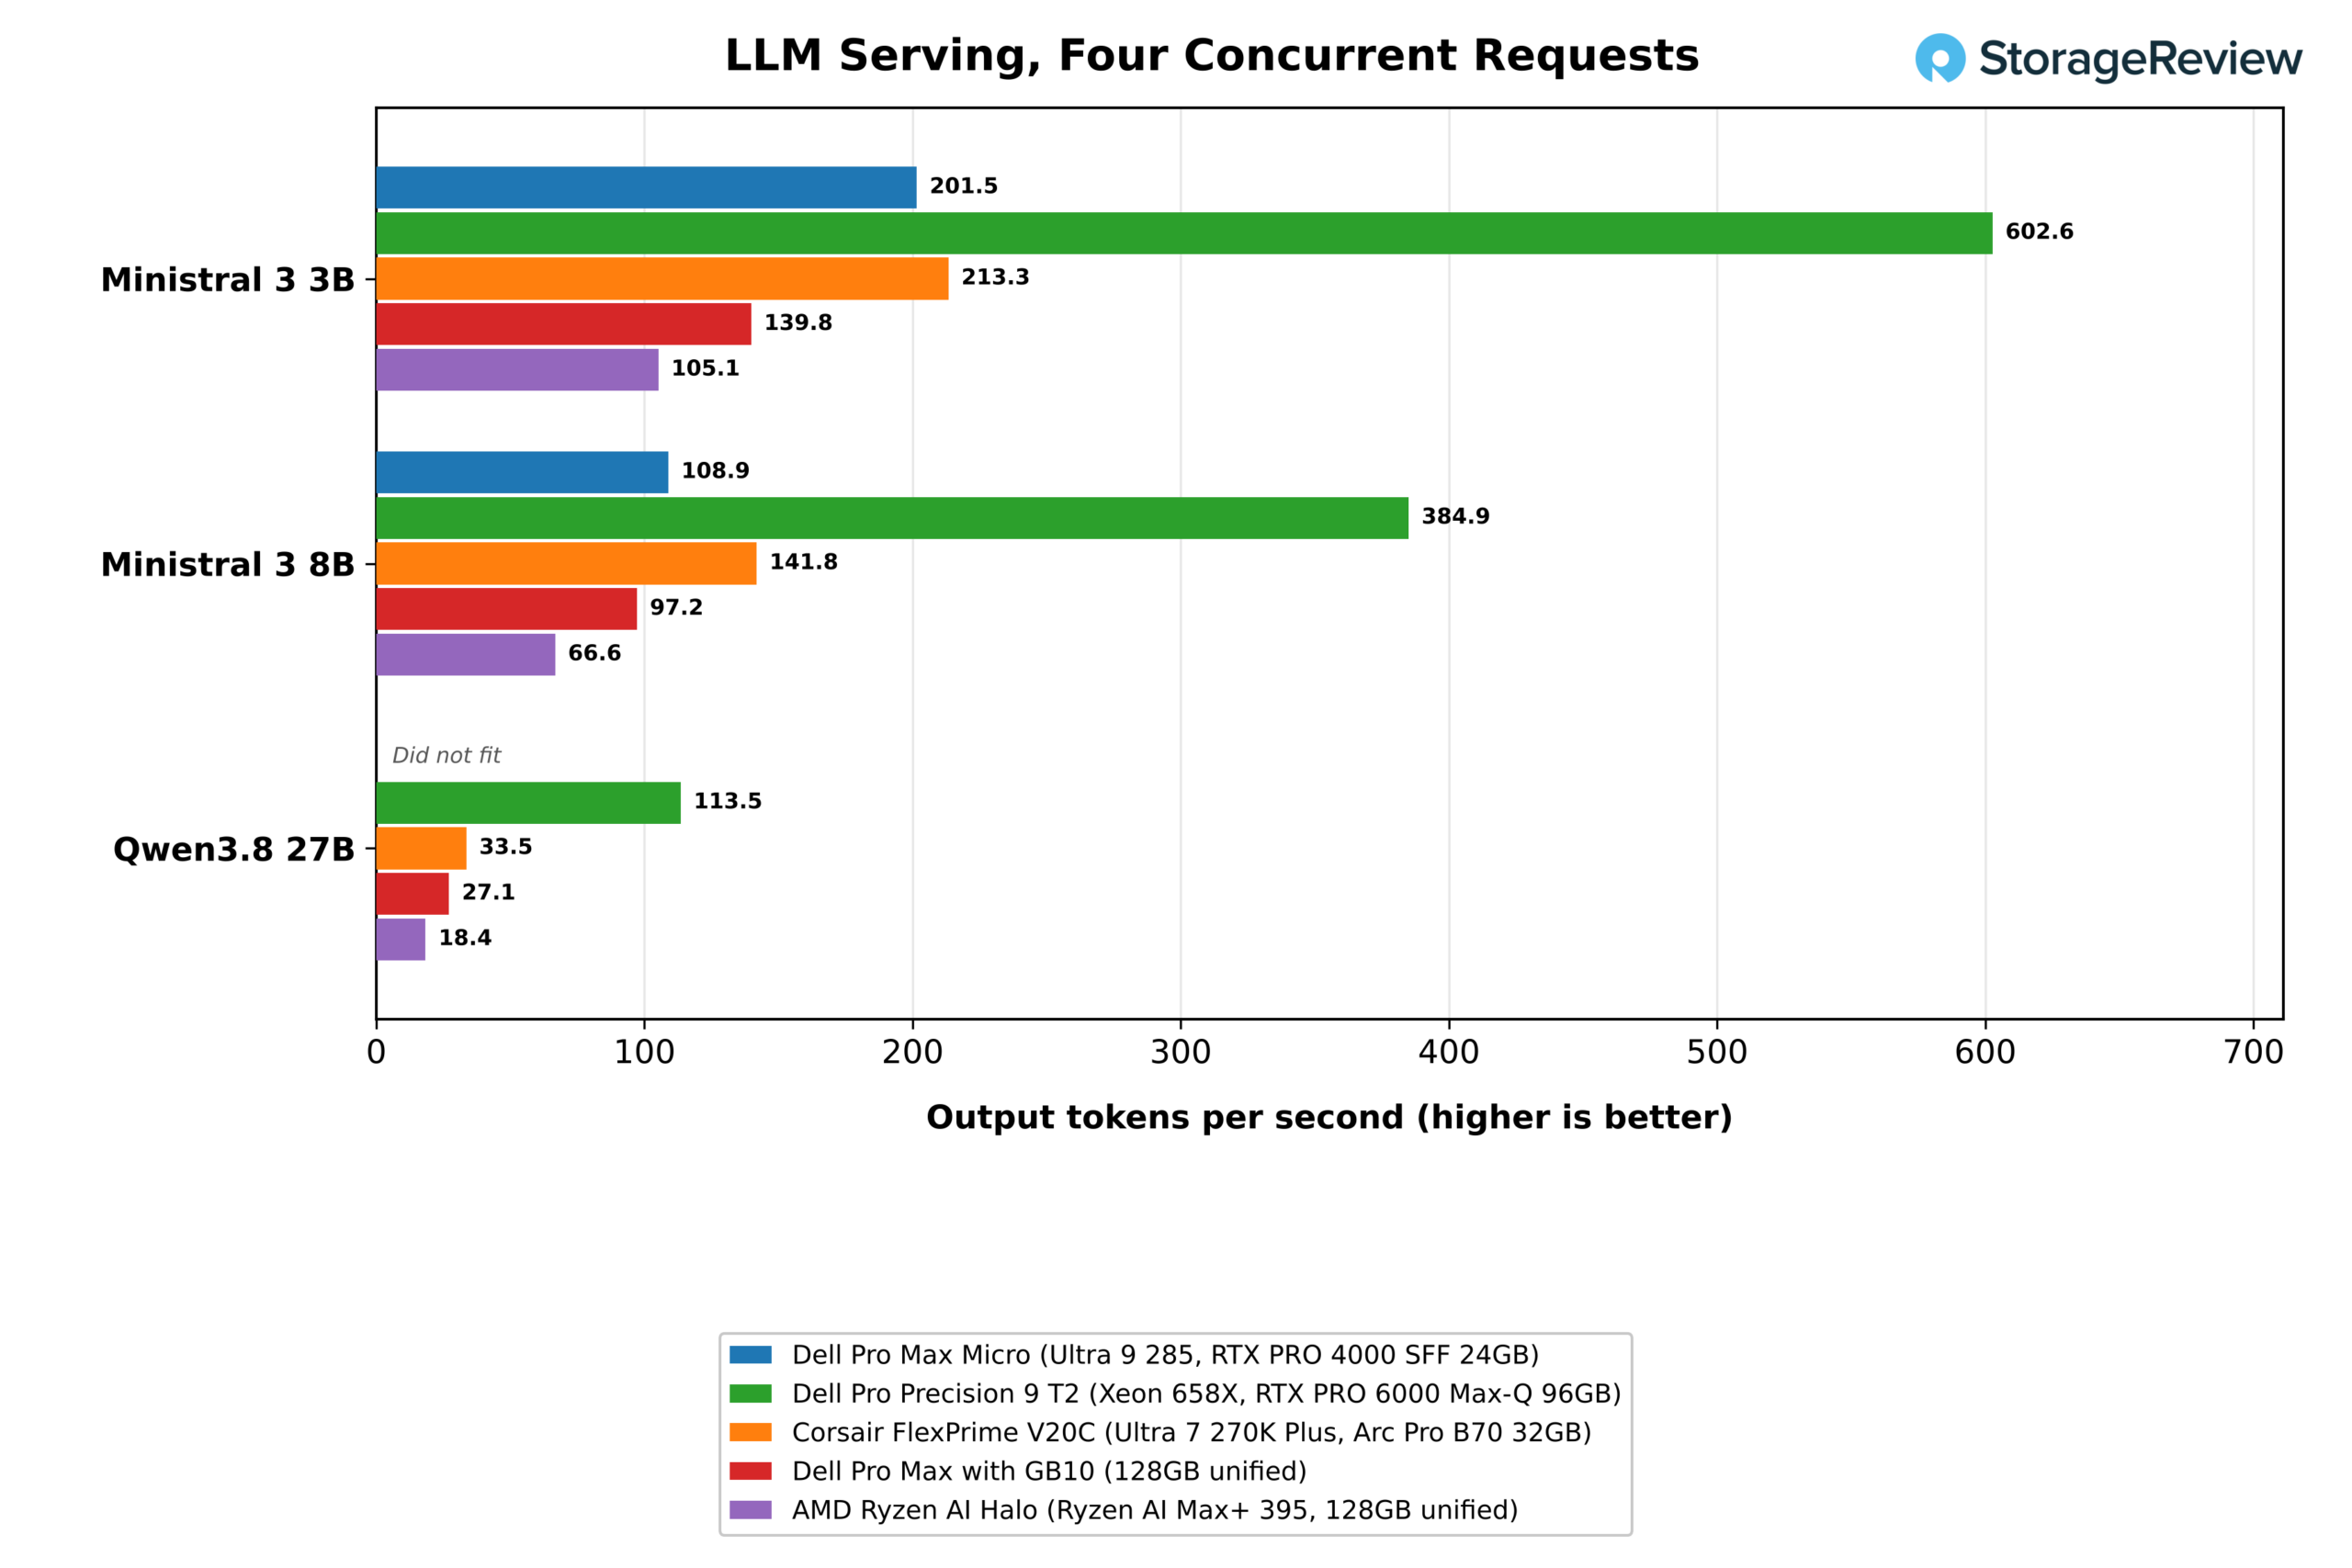
LLM serving runs the llama.cpp server with 4,096-token prompts and 1,024-token outputs on the Ministral 3 models. The Micro served the 3B model to one user at 80.7 tokens per second, 5 percent behind the Arc Pro B70 in the V20C and 52 percent ahead of the GB10, and the 8B model at 52.0 tokens per second, 18 percent behind the V20C and 41 percent ahead of the GB10. At four concurrent requests, it delivered 201.5 and 108.9 tokens per second, 44 and 12 percent ahead of the GB10.
The Halo’s integrated Radeon 8060S trailed every other system in this test. It served the 3B model at 43.0 tokens per second for one request and 105.1 across four, about half the Micro’s rate, and the 8B model at 30.6 and 66.6. Prompt processing was slower as well, with a median first token time of 1.7 seconds on the 3B model and 4.6 seconds on the 8B model, versus 0.7 and 1.5 seconds on the Micro.
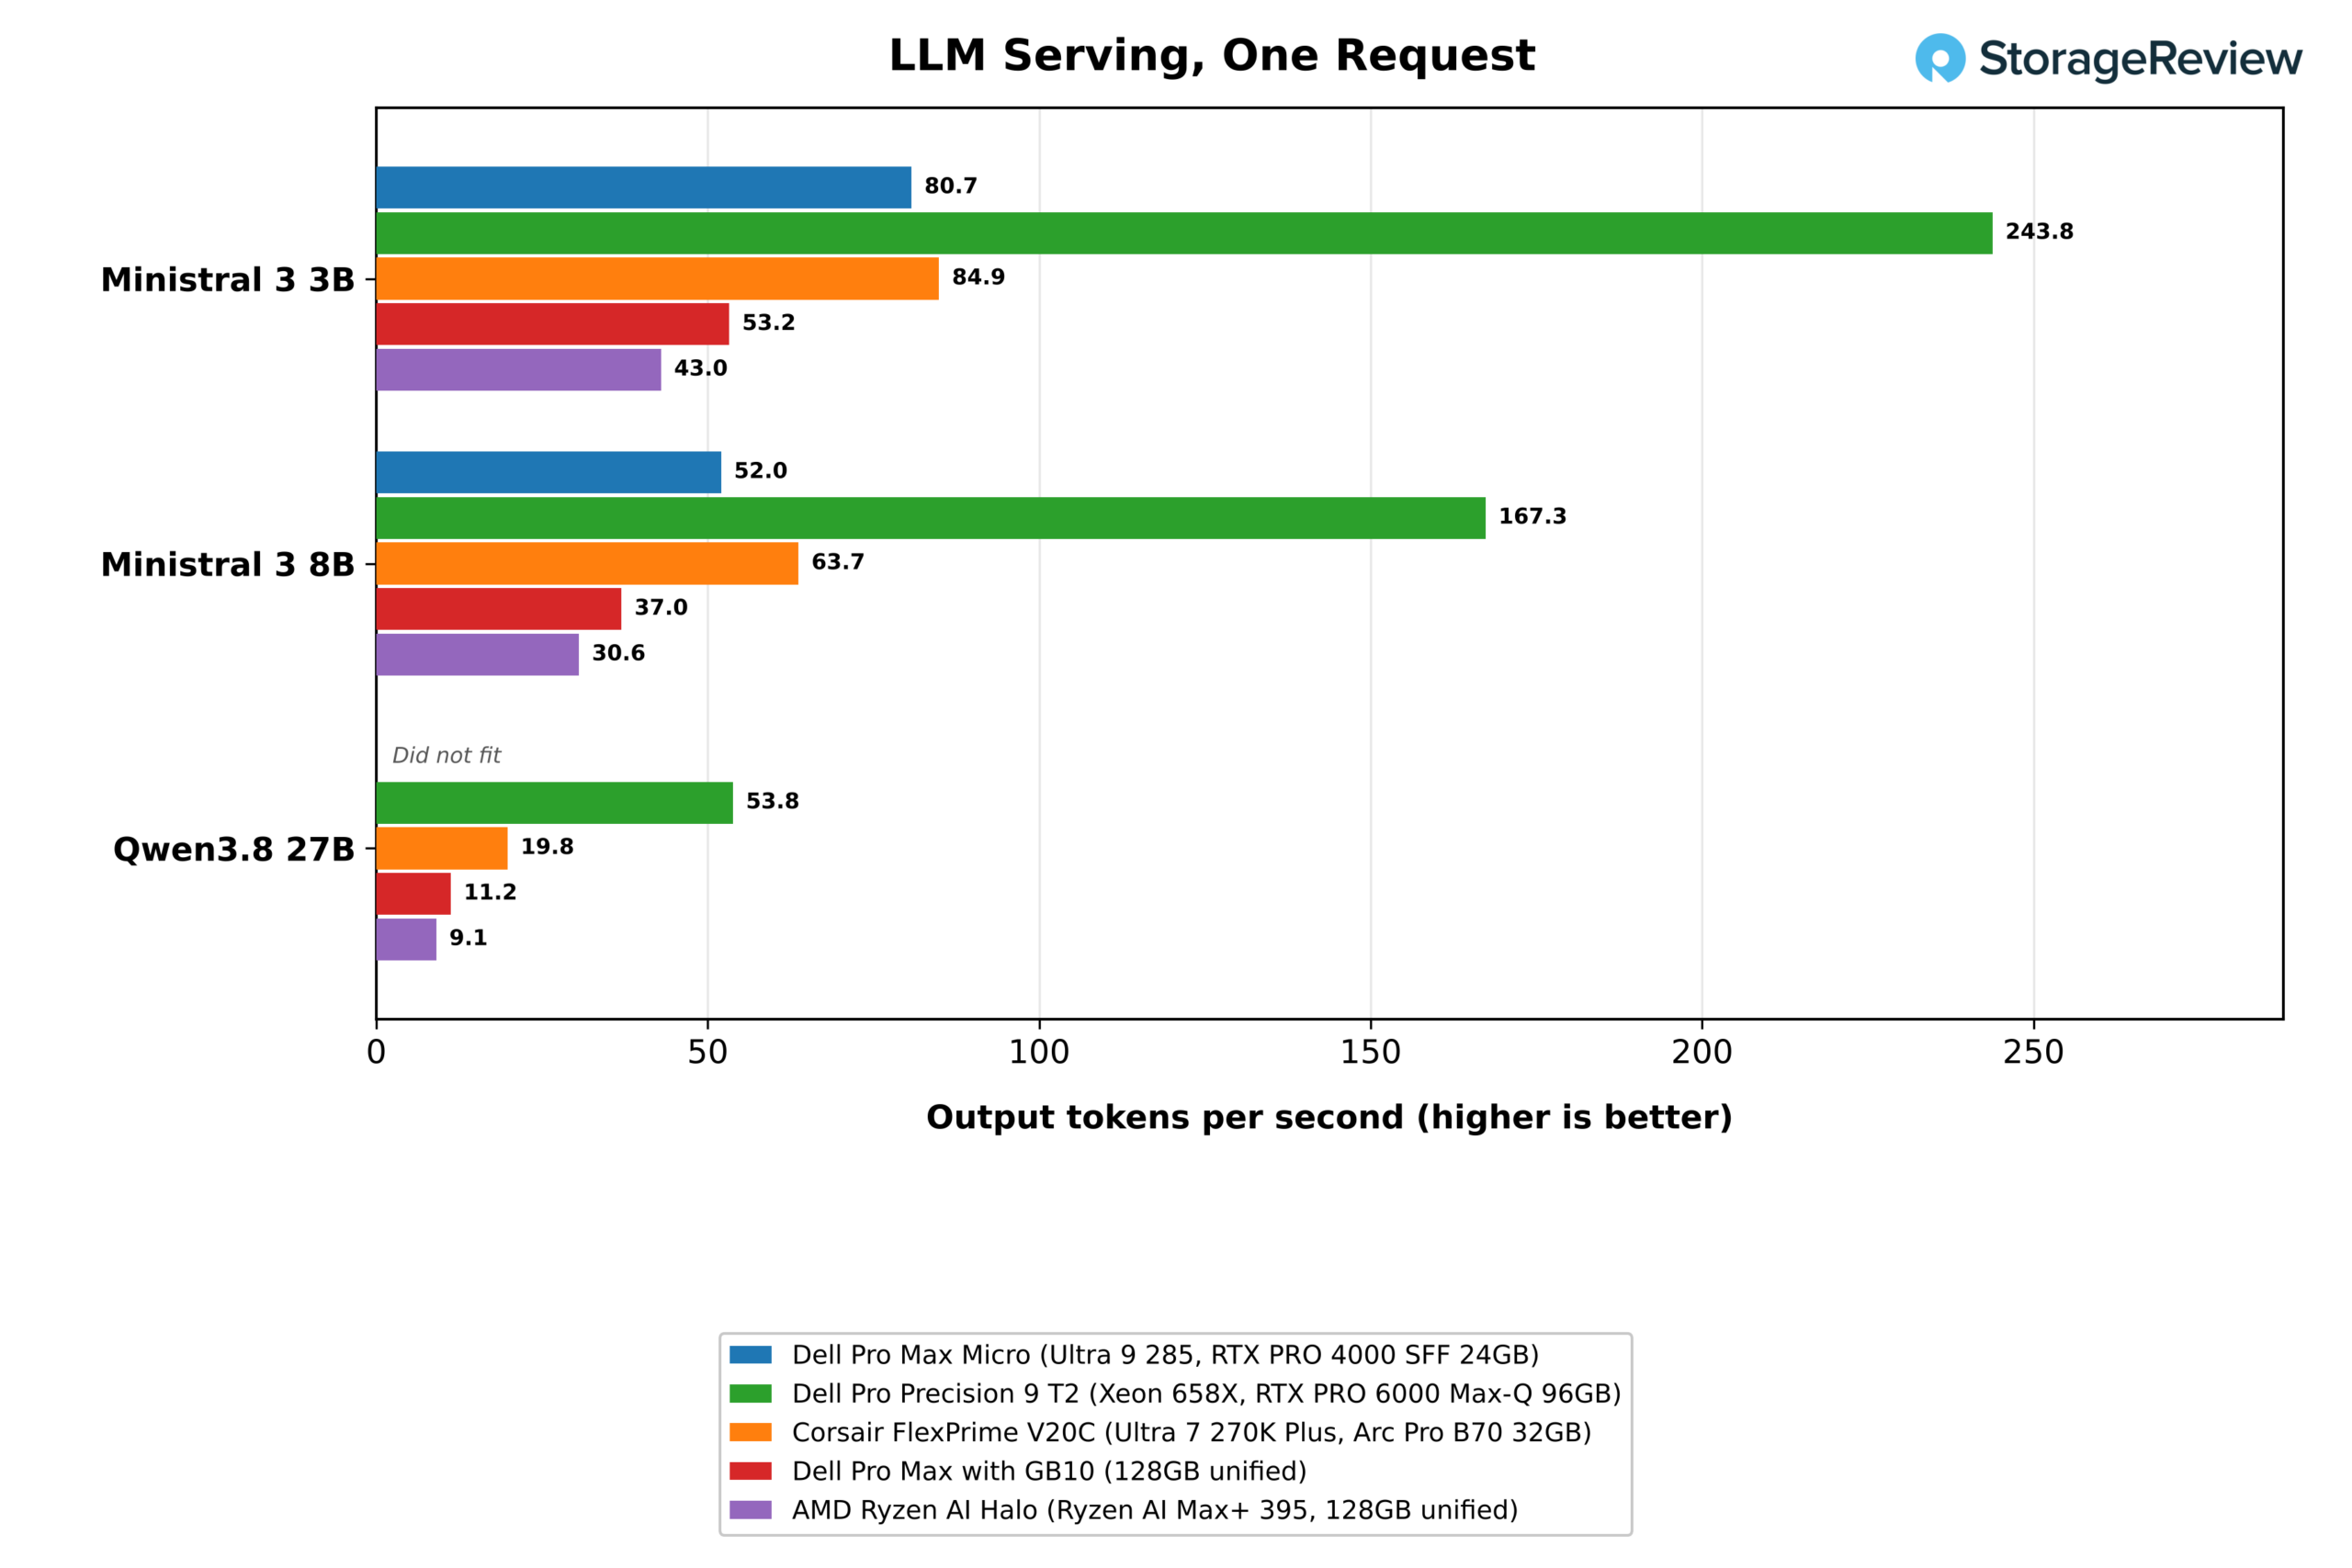
The Pro Precision 9 T2 delivers a substantial performance boost over the Micro. Its RTX PRO 6000 Max-Q served the 3B and 8B models at 243.8 and 167.3 tokens per second, respectively, with a single request, achieving 3.0 and 3.2 times the Micro’s throughput. With four concurrent requests, throughput rose to 602.6 and 384.9 tokens per second, respectively. It also ran Qwen3.8 27B at 53.8 tokens per second for one request and 155.8 across eight, with a first token in 2.8 seconds.
Qwen3.8 27B at Q4_K_M needs 30GB of GPU-usable memory for its weights and one request’s KV cache, so the Micro’s 23.9GB could not run it. The V20C generated 19.8 tokens per second on that model for one request; the GB10 generated 11.2, and the Halo generated 9.1. The same limit kept gpt-oss 120B, which needs 90GB, and the 129.3GB MiniMax M2.7 off the Micro. For serving, 24GB covers models through roughly the 20B class at 4-bit quantization, and anything larger belongs on a bigger card or a unified-memory system.
Model Loading and the Coding Agent
| gpt-oss:20b (Ollama 0.40.3) | Dell Pro Max Micro (Ultra 9 285, RTX PRO 4000 SFF 24GB) | Dell Pro Precision 9 T2 (Xeon 658X, RTX PRO 6000 Max-Q 96GB) | Corsair FlexPrime V20C (Ultra 7 270K Plus, Arc Pro B70 32GB) | Dell Pro Max with GB10 (128GB unified) | AMD Ryzen AI Halo (Ryzen AI Max+ 395, 128GB unified) |
|---|---|---|---|---|---|
| gpt-oss:20b cold load to first token (s, lower is better) | 5.11 | 5.57 | 6.29 | 6.86 | 4.20 |
| gpt-oss:20b warm load to first token (s, lower is better) | 3.12 | 3.47 | 3.18 | 6.36 | 4.03 |
| Coding agent, successful runs (of 3) | 1* | 2* | 3 | 3 | 2* |
| Coding agent, median wall time (s, lower is better) | 80* | 107* | 368 | 221 | 282* |
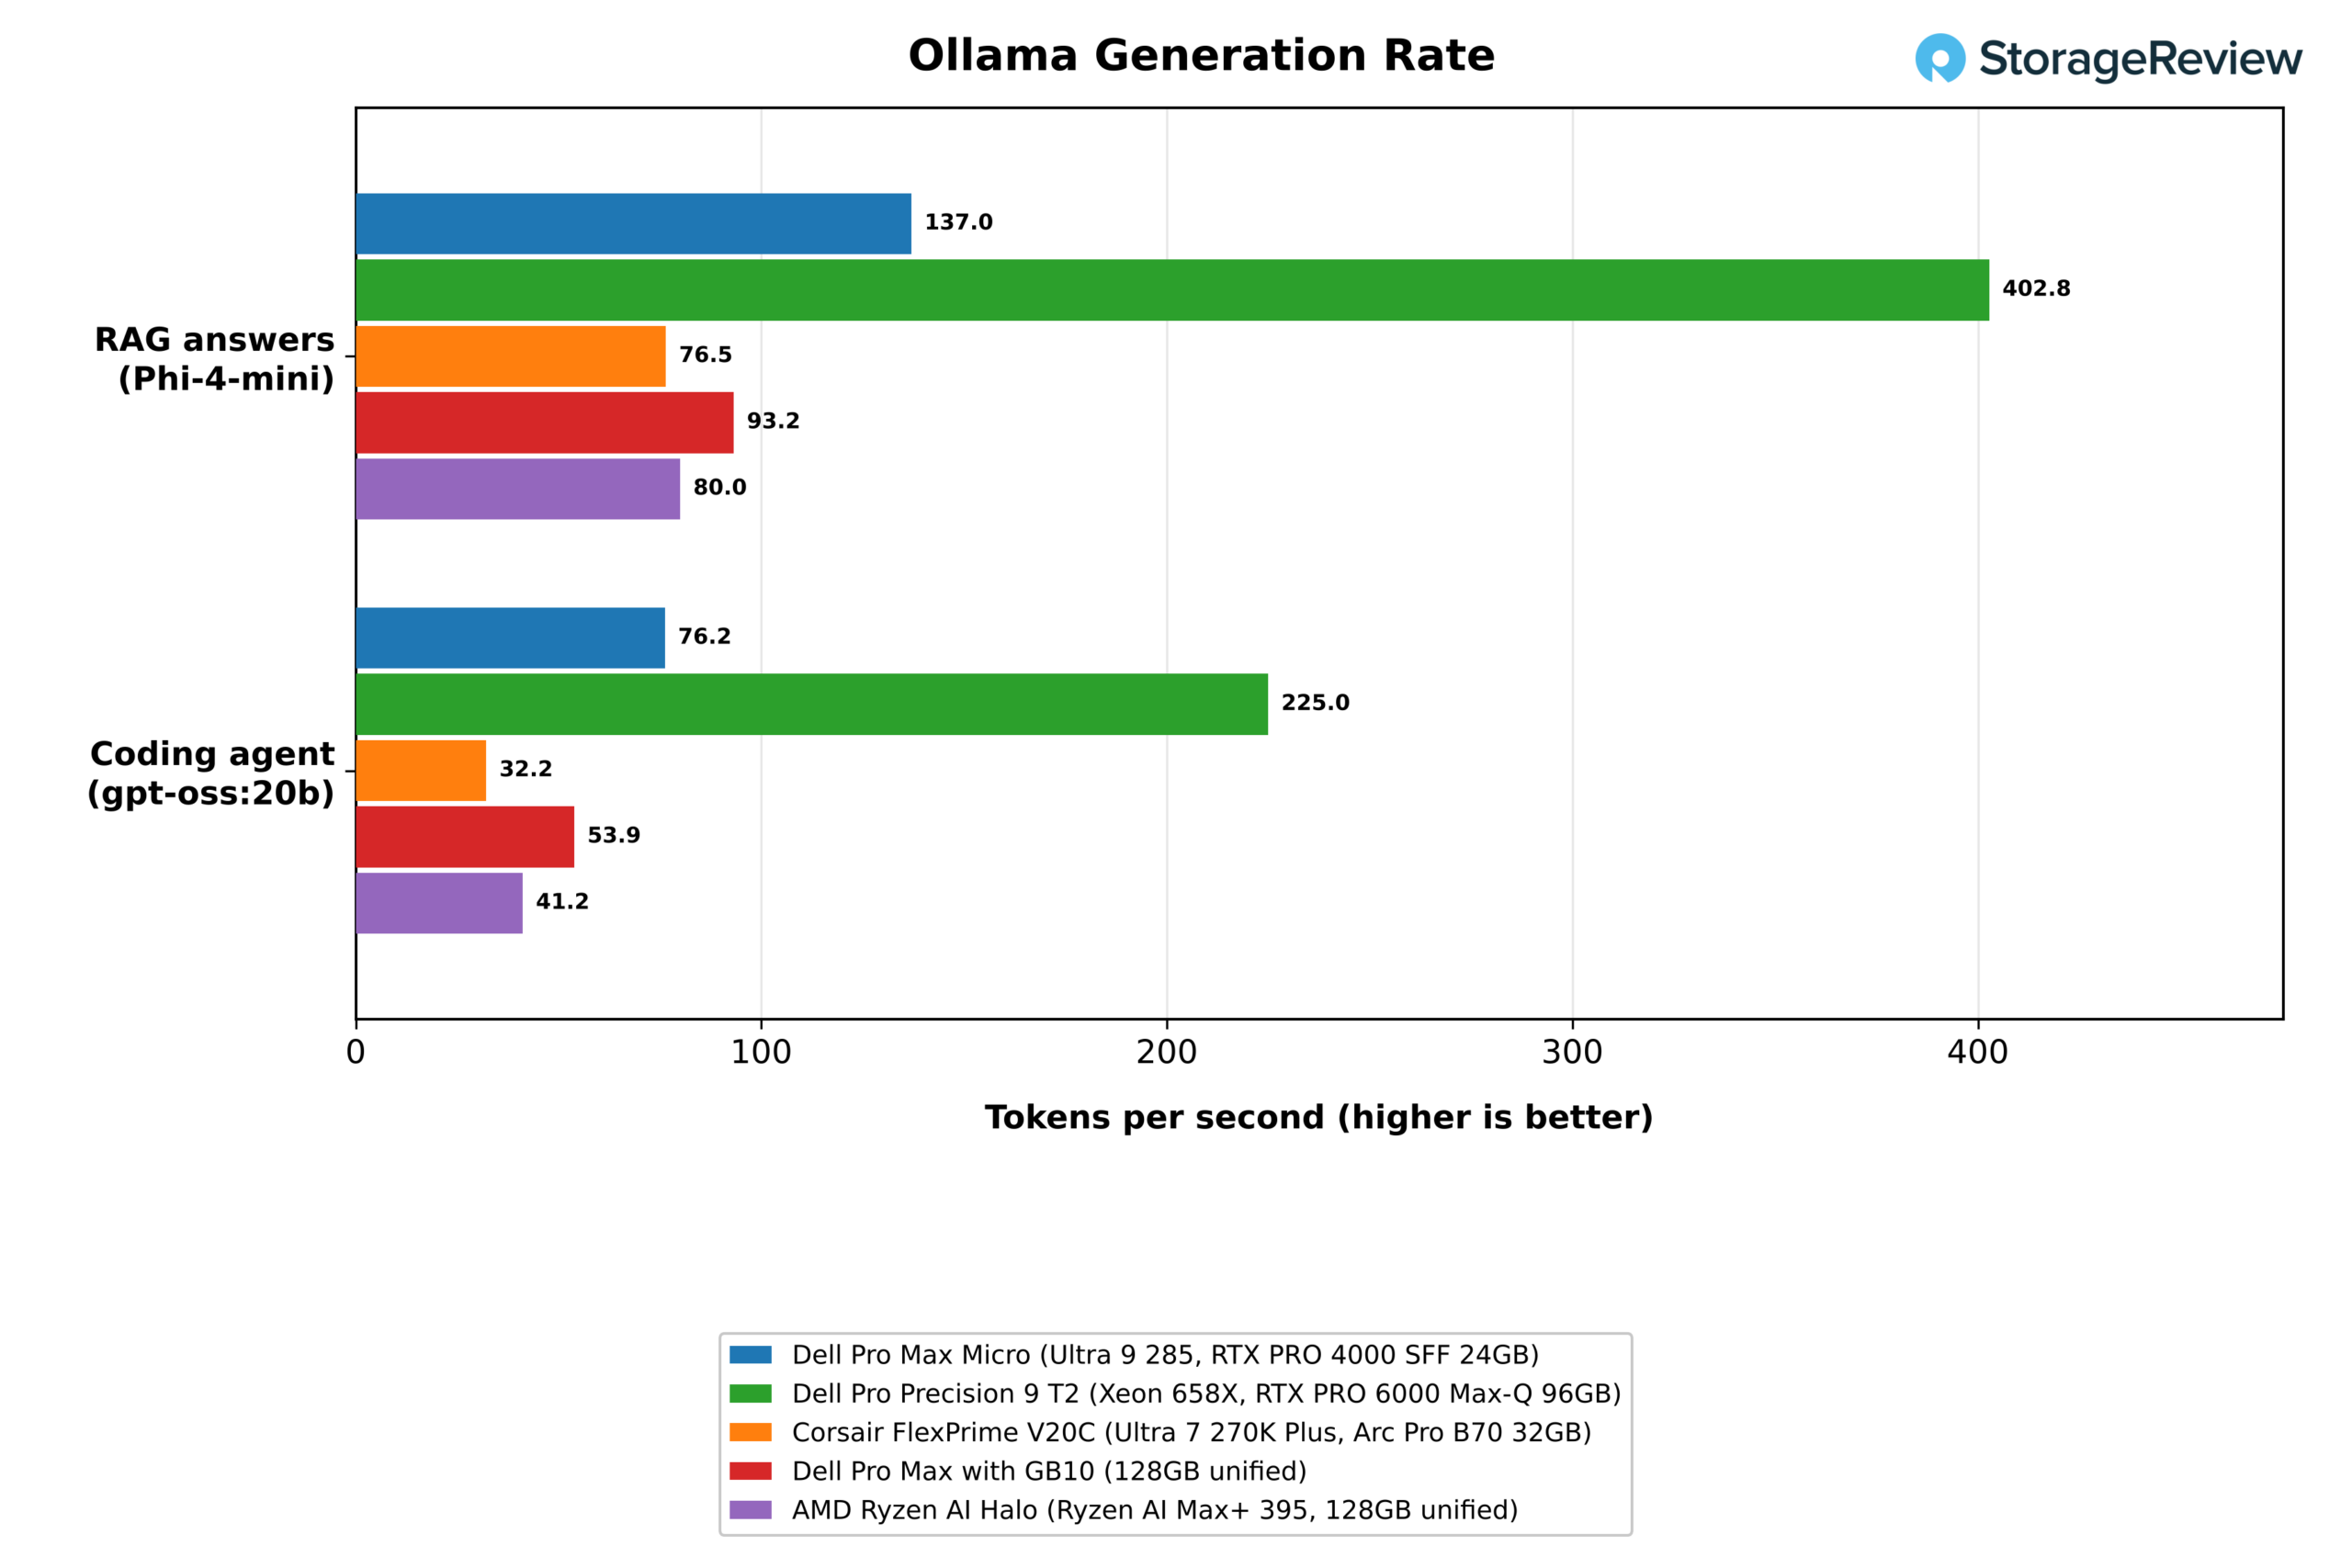
| Coding agent, generation rate (tokens/s) | 76.2 | 225.0 | 32.2 | 53.9 | 41.2 |
*Flagged by the suite: the Dell Pro Max Micro passed one of three agent runs, and the Pro Precision 9 T2 and the AMD Ryzen AI Halo passed two of three.
The model-load test times Ollama from launch to first token on gpt-oss:20b, a 12.8GB model, cold from the SSD and warm from the page cache. The Micro reached the first token in 5.11 seconds cold and 3.12 seconds warm, the fastest warm load in the group. Cold and warm loads took 5.57 and 3.47 seconds for the T2, 6.29 and 3.18 seconds for the V20C, and 6.86 and 6.36 seconds for the GB10. The Halo had the fastest cold load at 4.20 seconds and took 4.03 seconds warm. The Micro’s Gen5 drive read at 6,636MB/s during the cold load with a peak of 8,754MB/s, so storage keeps pace with the runtime.
The coding agent test runs Crush against gpt-oss:20b with a 64K context through a fixed programming task, three times. The Micro generated 76.2 tokens per second, ahead of the GB10 at 53.9, the Halo at 41.2, and the V20C at 32.2, and about a third of the T2’s 225.0, and its one passing run finished in 80 seconds. Its other two runs ended with 0 and 1 of 11 tests passing, where the T2 and the Halo passed two of three and the V20C and the GB10 passed all three. Pass counts on this model vary from run to run, so the generation rate is the hardware result.
RAG at Two Scales
| RAG, 20,963 passages (Ollama 0.40.3) | Dell Pro Max Micro (Ultra 9 285, RTX PRO 4000 SFF 24GB) | Dell Pro Precision 9 T2 (Xeon 658X, RTX PRO 6000 Max-Q 96GB) | Corsair FlexPrime V20C (Ultra 7 270K Plus, Arc Pro B70 32GB) | Dell Pro Max with GB10 (128GB unified) | AMD Ryzen AI Halo (Ryzen AI Max+ 395, 128GB unified) |
|---|---|---|---|---|---|
| Ingest, passages per second | 268.2 | 392.1 | 87.5 | 211.4 | 95.5 |
| Ingest, embedding rate (tokens/s) | 43,430 | 63,486 | 14,162 | 34,227 | 15,468 |
| Answer, generation rate (tokens/s) | 137.0 | 402.8 | 76.5 | 93.2 | 80.0 |
| Answer, time to first token p50 (s, lower is better) | 0.16 | 0.11 | 0.30 | 0.15 | 0.42 |
| Question to answer p50 (s, lower is better) | 0.22 | 0.14 | 0.39 | 0.22 | 0.50 |
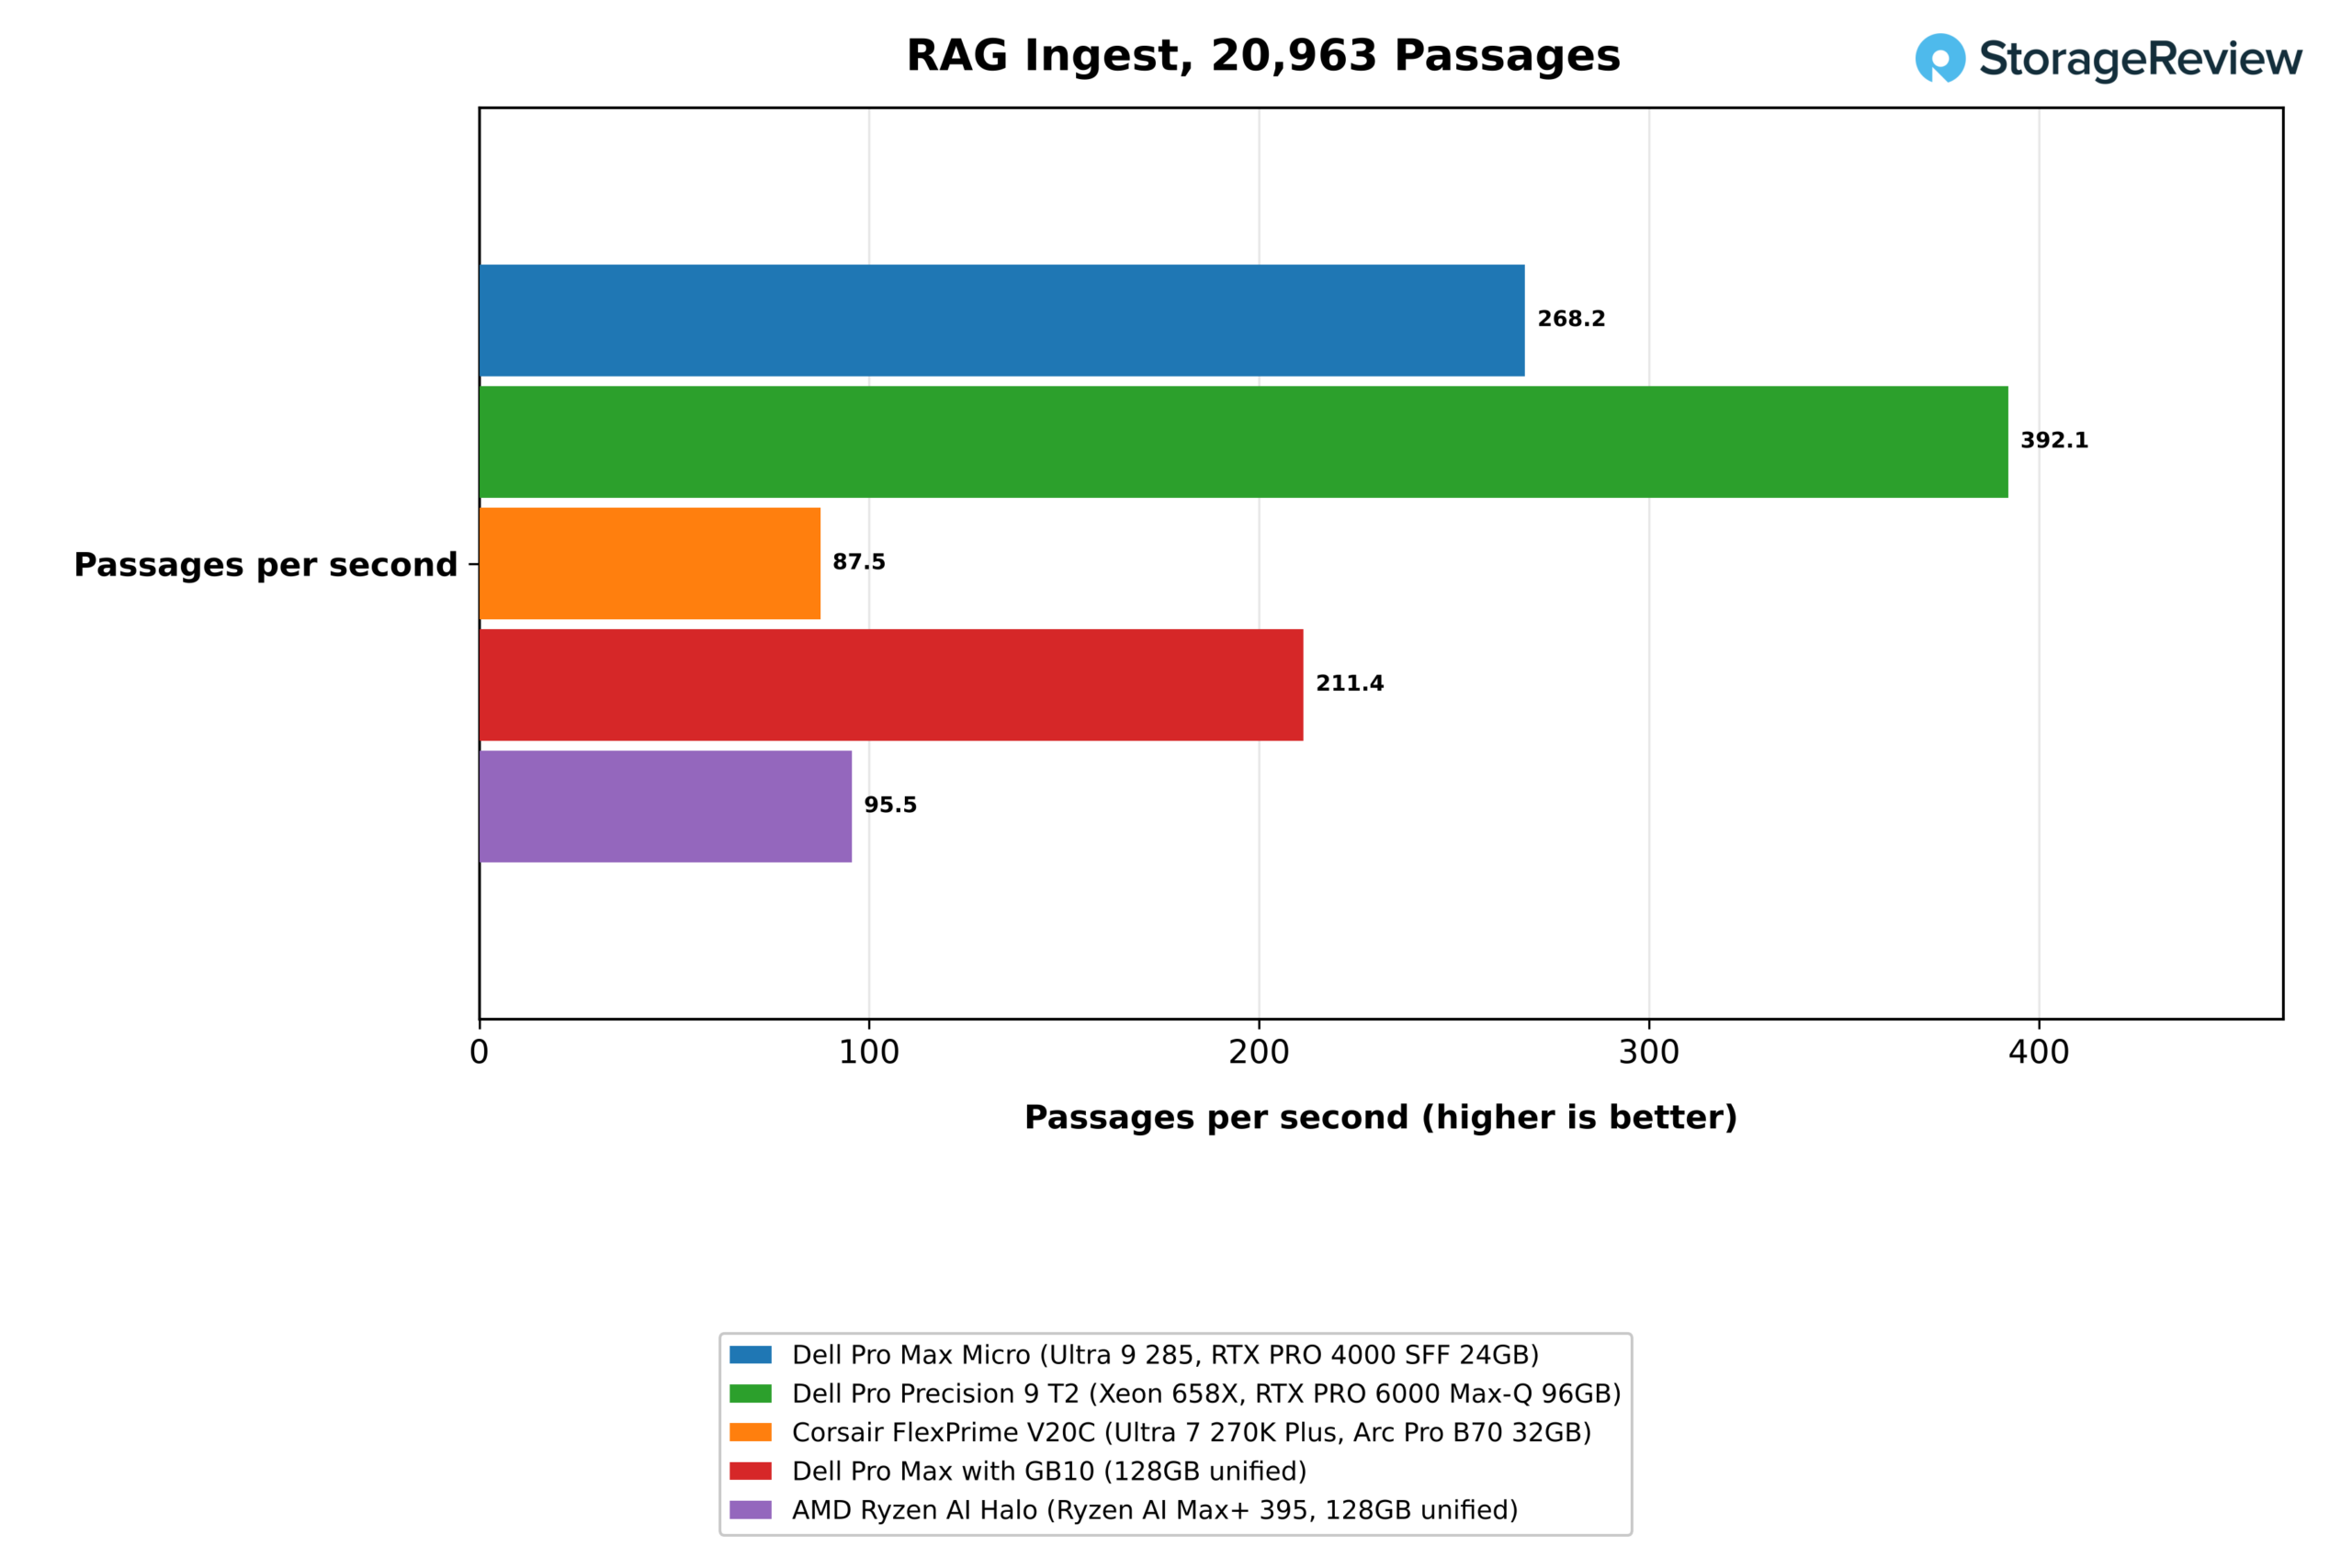
The RAG test embeds 20,963 SQuAD passages, retrieves the top five for each question, and answers with Phi-4-mini, all through Ollama. The Micro ingested 268.2 passages per second compared to 211.4 on the GB10, 95.5 on the Halo, and 87.5 on the V20C. That’s a 27 percent lead over the GB10 and about three times the Arc card’s rate on Vulkan, and the T2 reached 392.1. Answers generated at 137.0 tokens per second on the Micro against 93.2, 80.0, and 76.5, with the T2 at 402.8, and the Micro’s median time from question to answer was 0.22 seconds, level with the GB10.
| RAG at scale, 1,002,067 passages | Dell Pro Max Micro (Ultra 9 285, RTX PRO 4000 SFF 24GB) | Dell Pro Precision 9 T2 (Xeon 658X, RTX PRO 6000 Max-Q 96GB) | Corsair FlexPrime V20C (Ultra 7 270K Plus, Arc Pro B70 32GB) | AMD Ryzen AI Halo (Ryzen AI Max+ 395, 128GB unified) |
|---|---|---|---|---|
| Ingest, 1M passages (passages/s) | 313.9 | 1,140.9 | 321.4 | 65.8 |
| Ingest wall time (s, lower is better) | 3,192 | 878 | 3,118 | 15,230 |
| HNSW index build (s, lower is better) | 78.9 | 46.3 | 73.4 | 68.9 |
| HNSW search, ef 64 (queries/s) | 27,359 | 45,085 | 29,643 | 34,012 |
| HNSW search, ef 256 (queries/s) | 7,664 | 13,478 | 8,285 | 9,649 |
| Question to answer p50 (s, lower is better) | 0.20 | 0.12 | 0.36 | 0.46 |
The larger RAG test embeds a million Wikipedia passages through llama.cpp, builds an HNSW index on the CPU, and searches it. The Micro ingested 313.9 passages per second and finished in 53 minutes, 2 percent behind the V20C, whose SYCL backend is much stronger than its Vulkan path. The Micro’s embedding rates in the two tests were within 3 percent of each other at 43,430 and 44,440 tokens per second. The T2 embedded the same million passages in 878 seconds (under 15 minutes), at 3.6 times the Micro’s rate.
The CPU-side work went to the V20C by a small margin and to the T2 by a wide one. The Micro built the index in 78.9 seconds against 73.4 and 46.3, and searched it at 27,359 queries per second against 29,643 and 45,085 at an ef setting of 64, with recall against exact search at 91.4 percent. Answer generation in this test returns to Ollama, and the Micro’s median question-to-answer time of 0.20 seconds was well ahead of the V20C’s 0.36. The GB10 has not run the million-passage test yet.
The Halo completed the million-passage ingest in 15,230 seconds (about 4.2 hours) at 65.8 passages per second, roughly a fifth of the Micro’s rate. Its 16-core processor did better on the CPU side, building the index in 68.9 seconds and searching it at 34,012 queries per second at an ef setting of 64, ahead of the Micro and the V20C in both, with a median question-to-answer time of 0.46 seconds.
Image Generation
| stable-diffusion.cpp, 1024×1024 (images/min, higher is better) | Dell Pro Max Micro (Ultra 9 285, RTX PRO 4000 SFF 24GB) | Dell Pro Precision 9 T2 (Xeon 658X, RTX PRO 6000 Max-Q 96GB) | Corsair FlexPrime V20C (Ultra 7 270K Plus, Arc Pro B70 32GB) | Dell Pro Max with GB10 (128GB unified) | AMD Ryzen AI Halo (Ryzen AI Max+ 395, 128GB unified) |
|---|---|---|---|---|---|
| FLUX.2 klein 4B Q4_0 (images/min) | 11.46 | 40.53 | 4.26 | 9.96 | 3.86 |
| FLUX.2 klein 4B BF16 (images/min) | 10.93 | 41.32 | 2.40 | 10.28 | 4.17 |
| Z-Image Turbo 6B Q4_0 (images/min) | 4.39 | 16.97 | 2.11 | 3.68 | 1.85 |
| Z-Image Turbo 6B BF16 (images/min) | 3.95 | 17.27 | 0.96 | 3.94 | 0.47 |
| Qwen-Image 20B Q4_0 (images/min) | Did not fit | 2.42 | 0.35 | 0.50 | 0.23 |
| Qwen-Image 20B Q8_0 (images/min) | Did not fit | 2.39 | Did not fit | 0.48 | 0.23 |
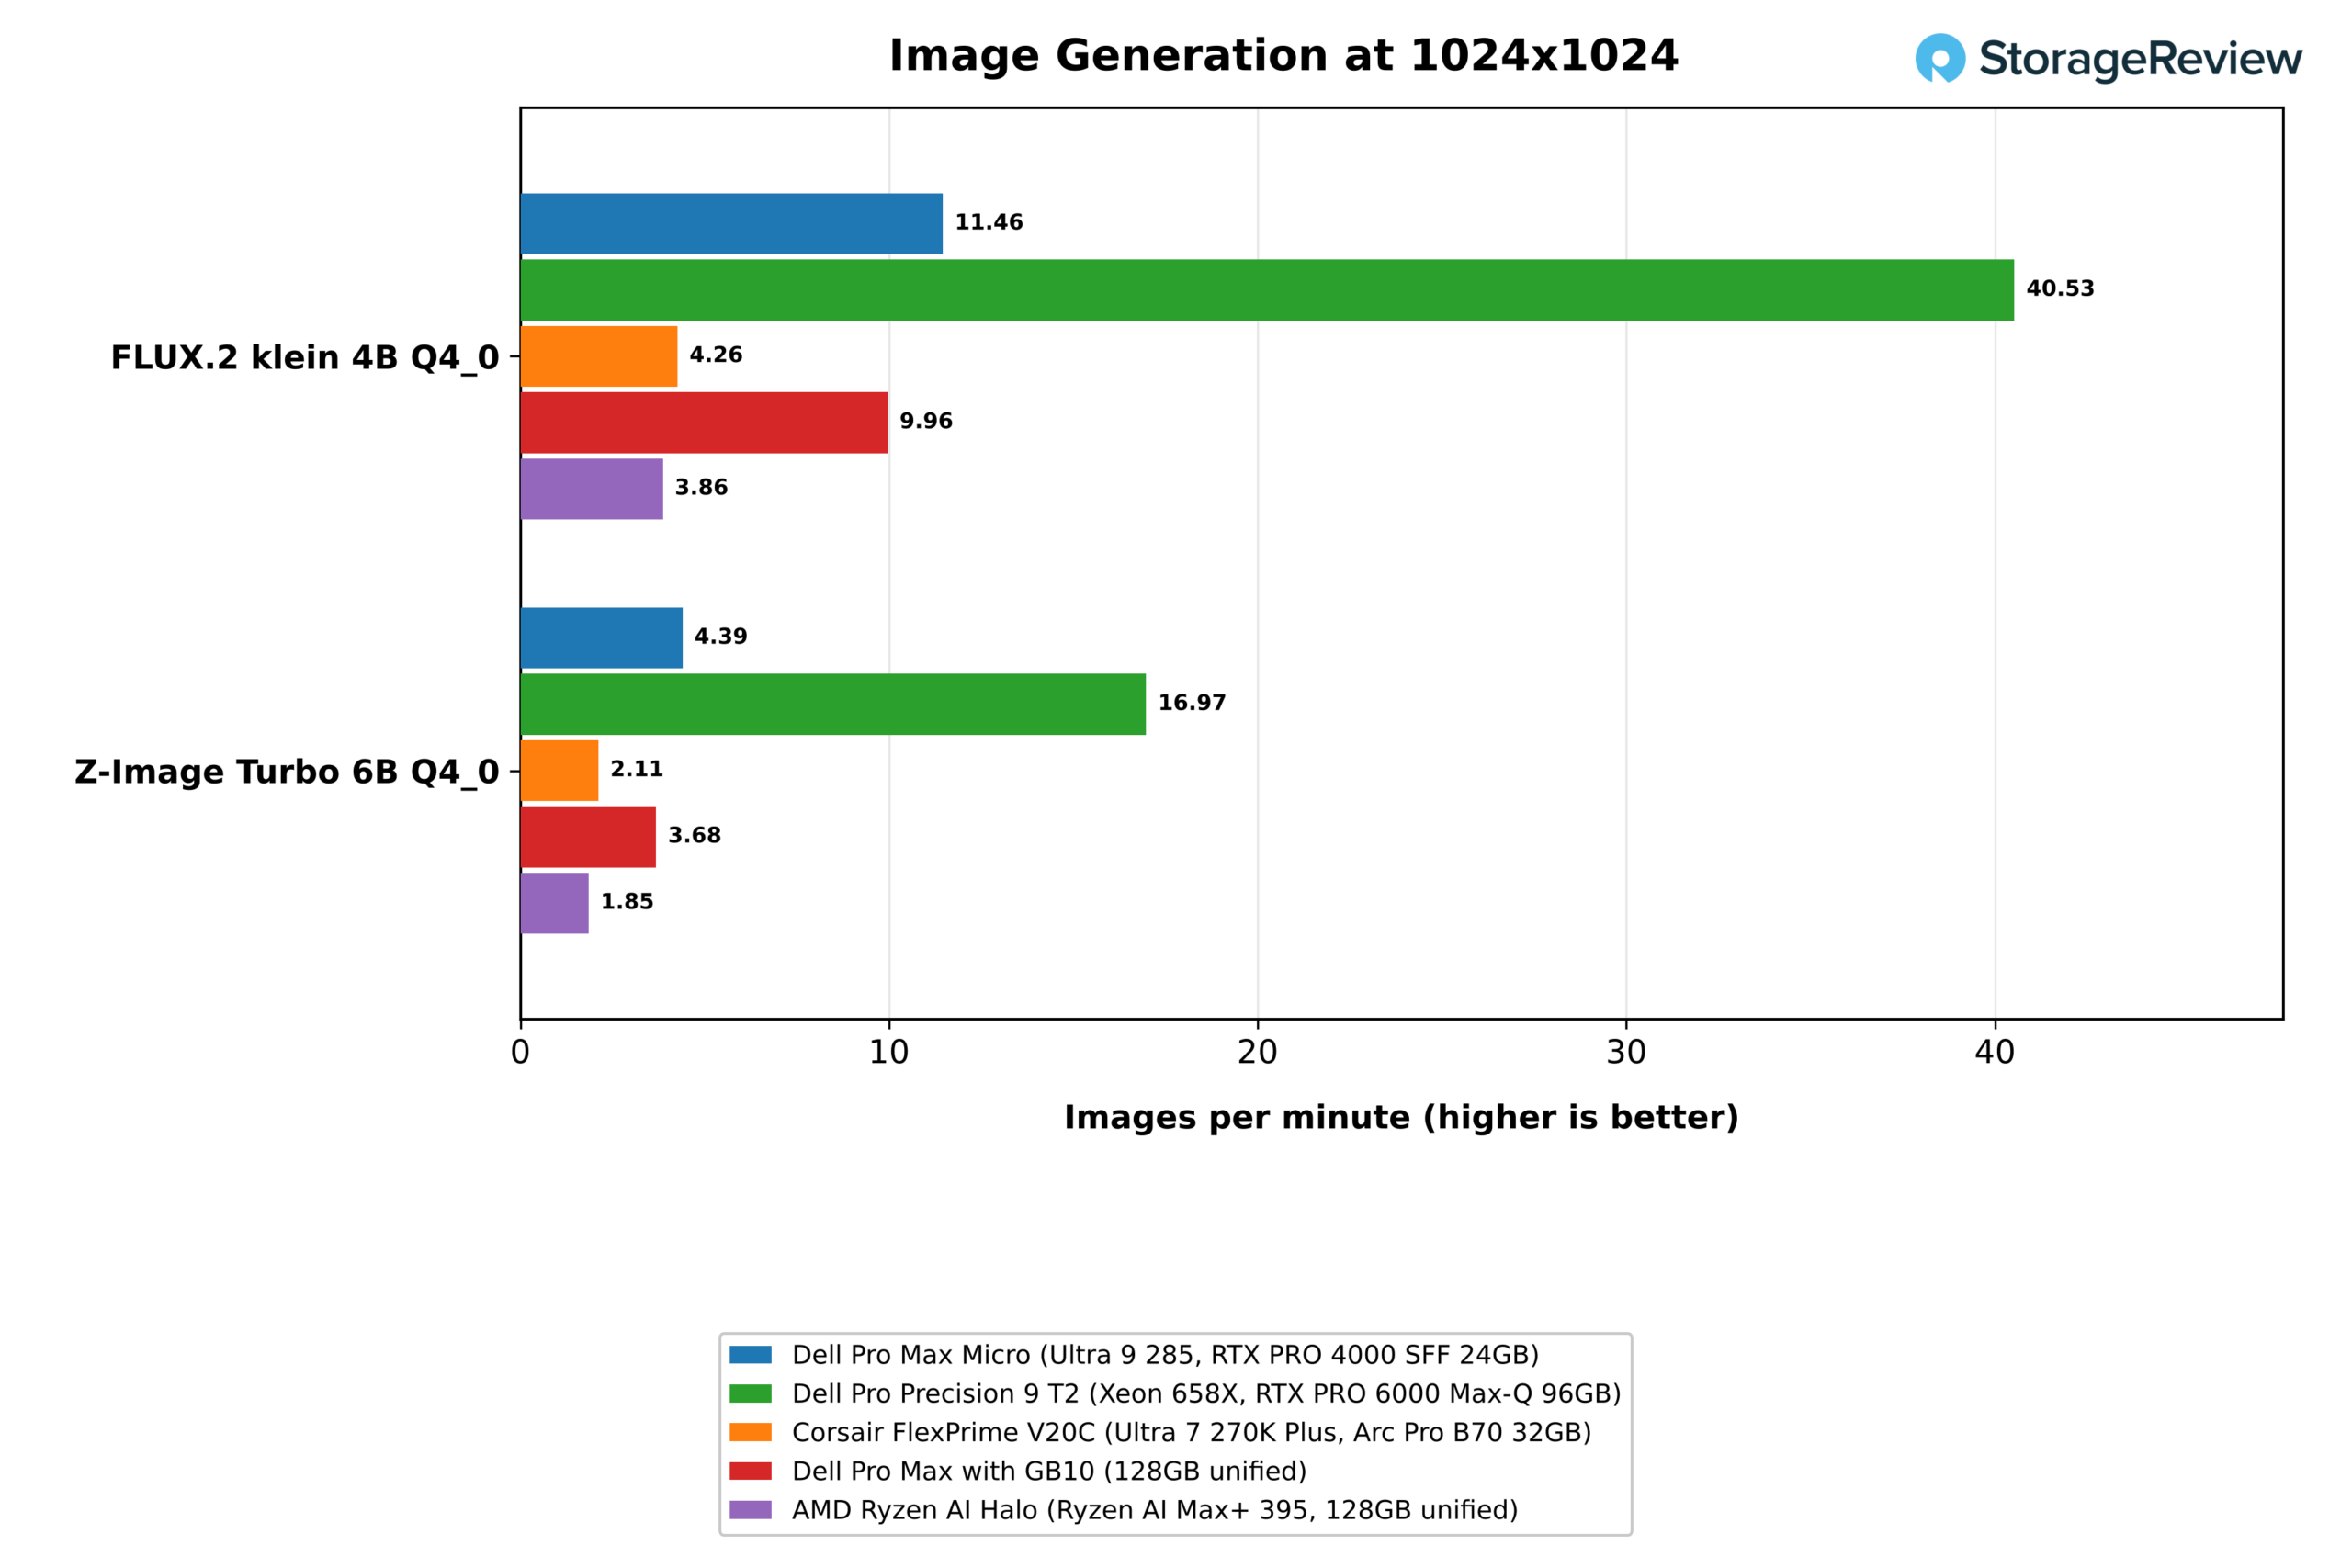
Image generation was the Micro’s strongest result against the three systems outside Dell’s line. On stable-diffusion.cpp with CUDA, it produced 11.46 images per minute on FLUX.2 klein 4B at Q4_0, 15 percent ahead of the GB10 at 9.96, 2.7 times the V20C’s 4.26 on Vulkan, and three times the Halo’s 3.86 on ROCm. Z-Image Turbo 6B ran at 4.39 images per minute, compared with 3.68, 2.11, and 1.85. Precision barely moved the result, with BF16 at 10.93 on FLUX.2 klein and 3.95 on Z-Image Turbo. The T2’s card produced 40.53 FLUX.2 images per minute, 3.5 times the Micro.
Memory capacity is the limit again on the largest model. Qwen-Image 20B needs 28GB of GPU-usable memory at Q4_0 and 38GB at Q8_0, so it did not load on the 24GB card. The V20C ran the Q4_0 version at 0.35 images per minute; the GB10 ran both at 0.50 and 0.48; the Halo ran both at 0.23; and the T2 ran both at 2.42 and 2.39. Buyers who need that model class locally should plan on more graphics memory than this chassis can hold, since the RTX PRO 4000 SFF is the top card Dell offers in the Micro.
CPU Performance
7-Zip, Blender, HandBrake, and LLVM
| Test | Dell Pro Max Micro (Ultra 9 285, RTX PRO 4000 SFF 24GB) | Dell Pro Precision 9 T2 (Xeon 658X, RTX PRO 6000 Max-Q 96GB) | Corsair FlexPrime V20C (Ultra 7 270K Plus, Arc Pro B70 32GB) | Dell Pro Max with GB10 (128GB unified) | AMD Ryzen AI Halo (Ryzen AI Max+ 395, 128GB unified) |
|---|---|---|---|---|---|
| 7-Zip, all threads, total (GIPS) | 164.0 | 285.1 | 199.6 | 149.5 | 215.8 |
| 7-Zip, one thread, total (GIPS) | 10.90 | 9.27 | 11.26 | 9.68 | 9.66 |
| Blender 4.5 Monster (samples/min) | 243.1 | 400.7 | 330.4 | No arm64 build | 285.3 |
| Blender 4.5 Junkshop (samples/min) | 161.6 | 266.9 | 212.5 | No arm64 build | 173.9 |
| Blender 4.5 Classroom (samples/min) | 114.5 | 187.2 | 152.8 | No arm64 build | 144.0 |
| HandBrake x265 (fps) | 39.7 | 41.5 | 49.6 | No arm64 build | 44.5 |
| HandBrake SVT-AV1 (fps) | 147.9 | 198.5 | 177.4 | No arm64 build | 194.1 |
| LLVM build (s, lower is better) | 173 | 106 | 136 | 175 | 149 |
The Core Ultra 9 285 is a 65W desktop processor that Dell runs at 85W in the Micro, and it shares its 24-core layout with the 270K Plus in the V20C. The Micro scored 164.0 GIPS in 7-Zip, 18 percent below the V20C’s 199.6 GIPS, and was 24 to 26 percent slower across the three Blender scenes. The V20C benefits from a tower chassis and a 360mm liquid cooler. HandBrake’s x265 and SVT-AV1 encodes were 20 and 17 percent slower. Blender and HandBrake have no arm64 Linux builds in our suite, so the GB10 has no results there.
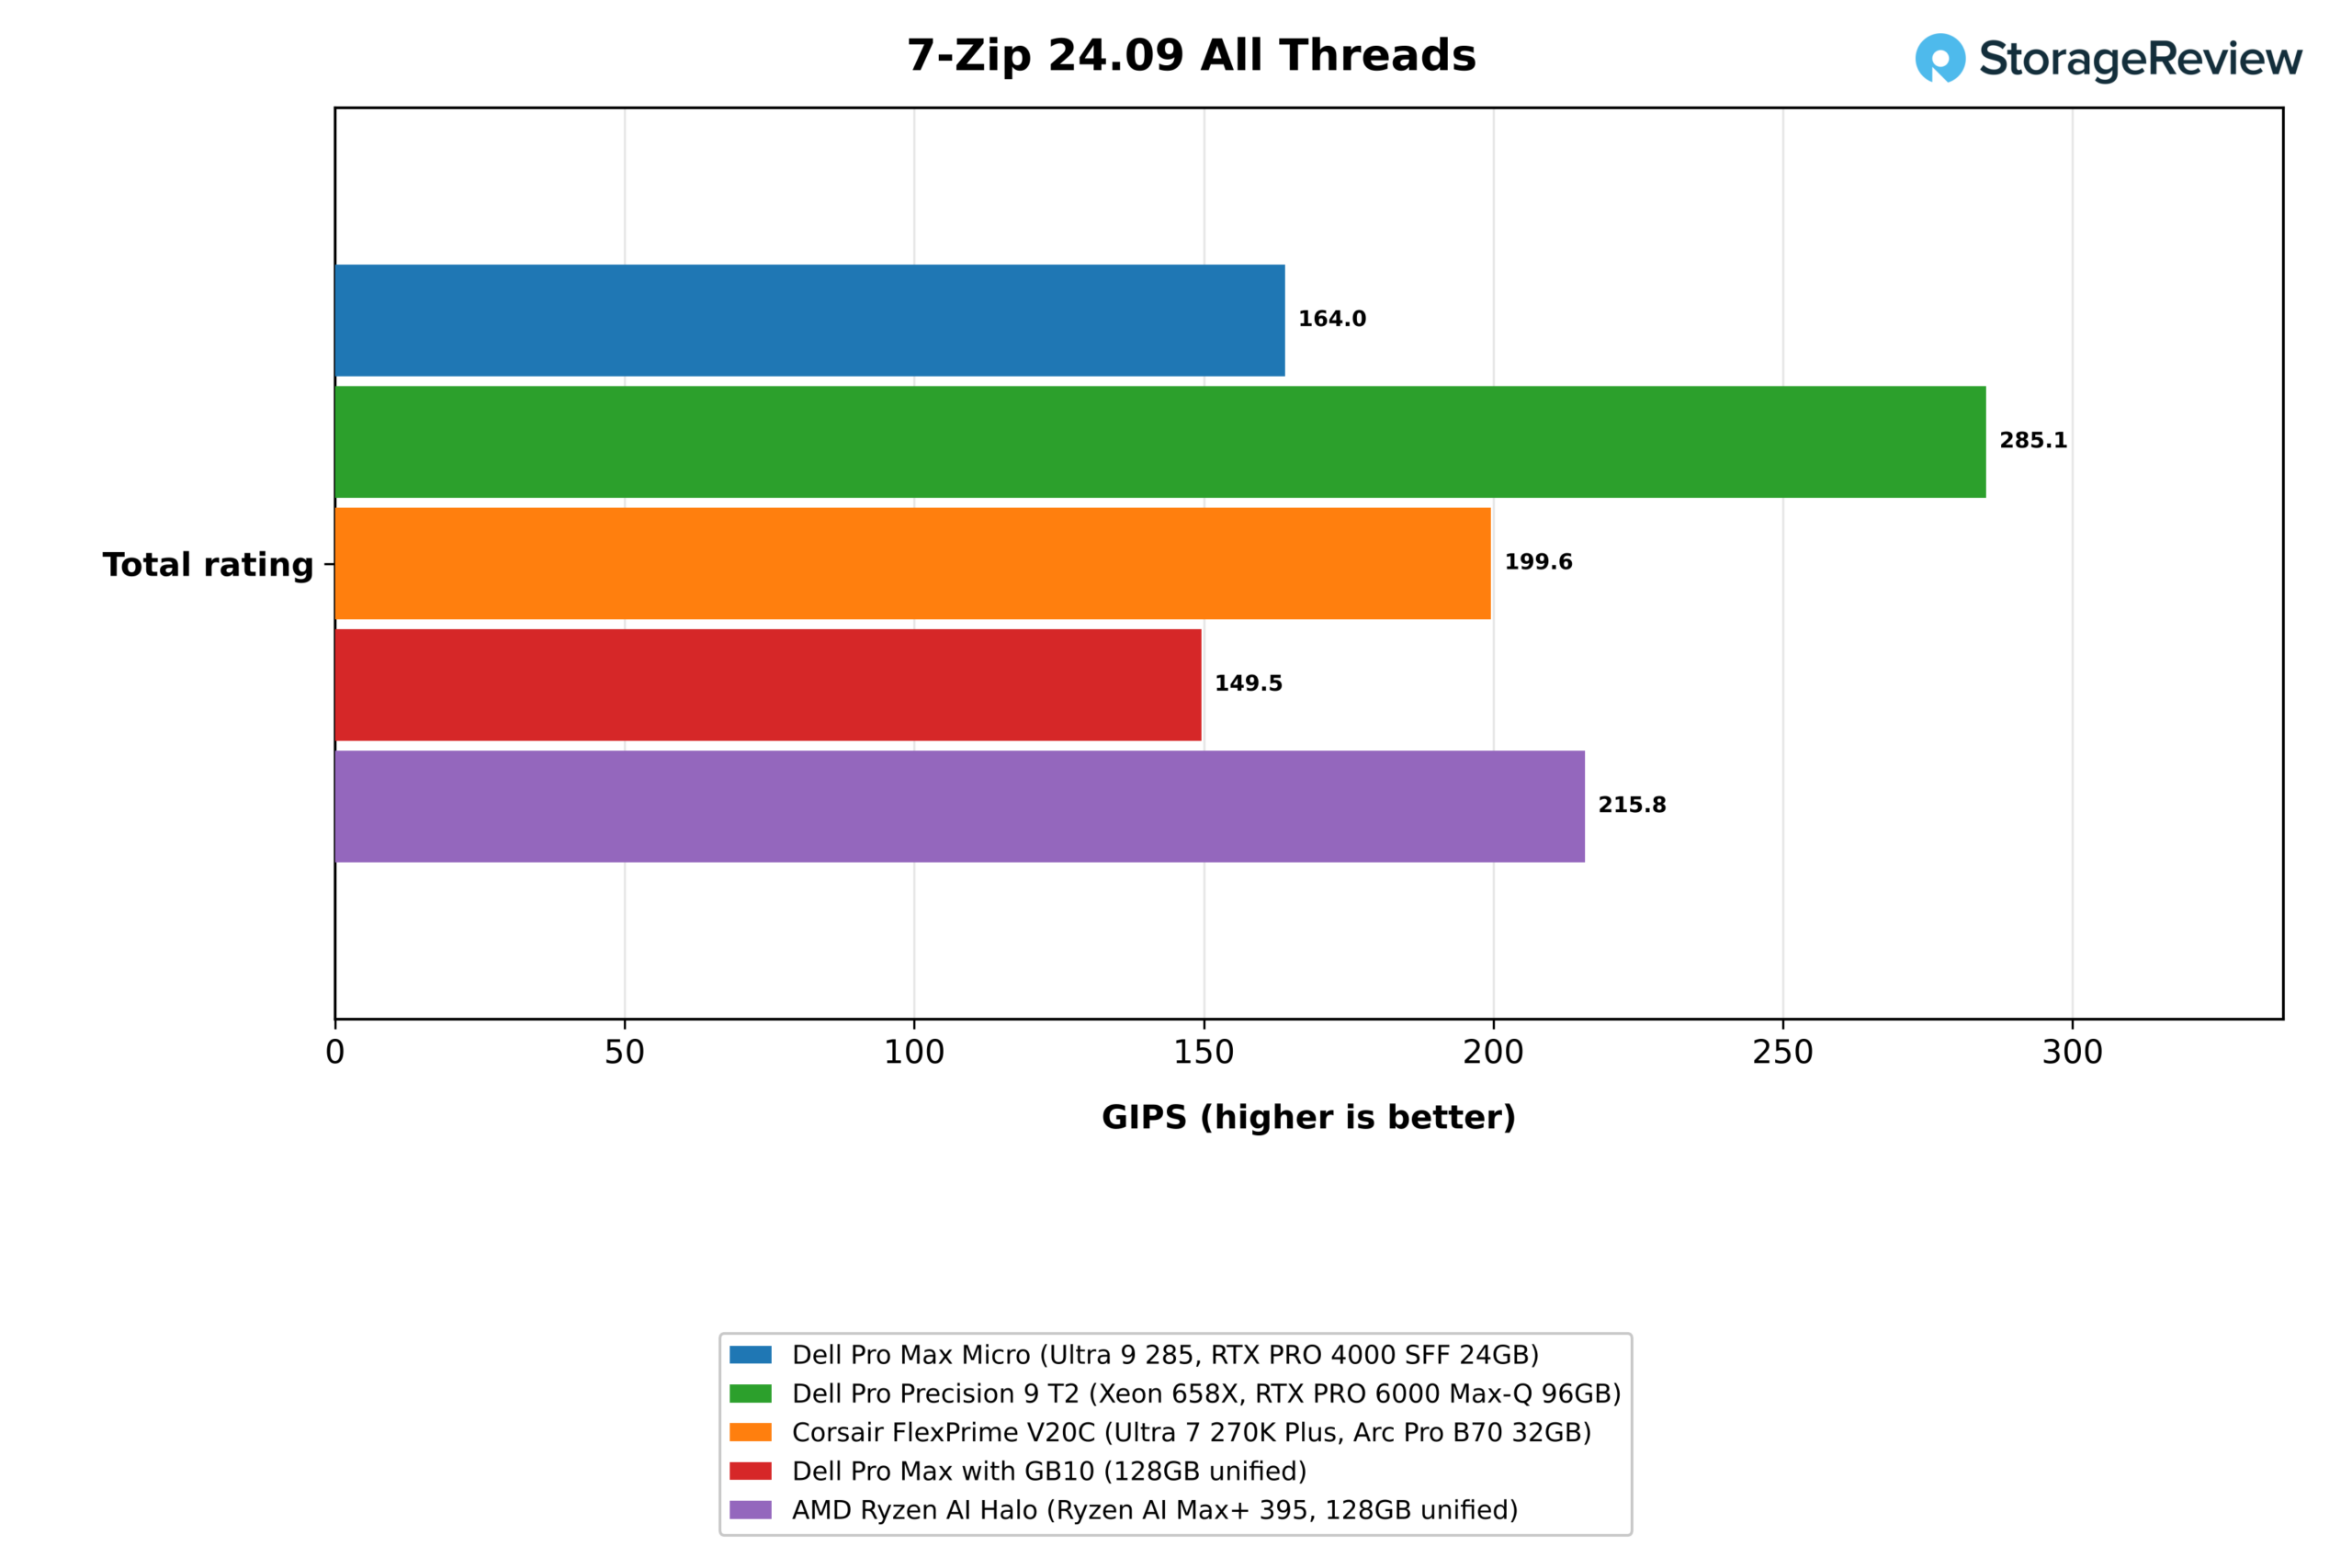
Against the GB10, the Micro was 10 percent ahead in all-thread 7-Zip and 13 percent ahead with one thread, and the LLVM build finished level at 173 seconds against 175. The V20C completed that build in 136 seconds. For a system this size, the result is reasonable, and the comparison shows the cost of the form factor: a processor with the same core layout delivers 22 percent more 7-Zip throughput and 32 to 36 percent more Blender throughput in a liquid-cooled tower than the 285 does at 85W in 2.9 liters.
The Halo’s 16-core, 32-thread Ryzen AI Max+ 395 also finished ahead of the Micro in multi-threaded work. It scored 215.8 GIPS in 7-Zip, 32 percent ahead; ran 8 to 26 percent ahead across the Blender scenes; encoded SVT-AV1 at 194.1 fps against 147.9; and built LLVM in 149 seconds against 173. The Micro kept a 13 percent lead in one-thread 7-Zip.
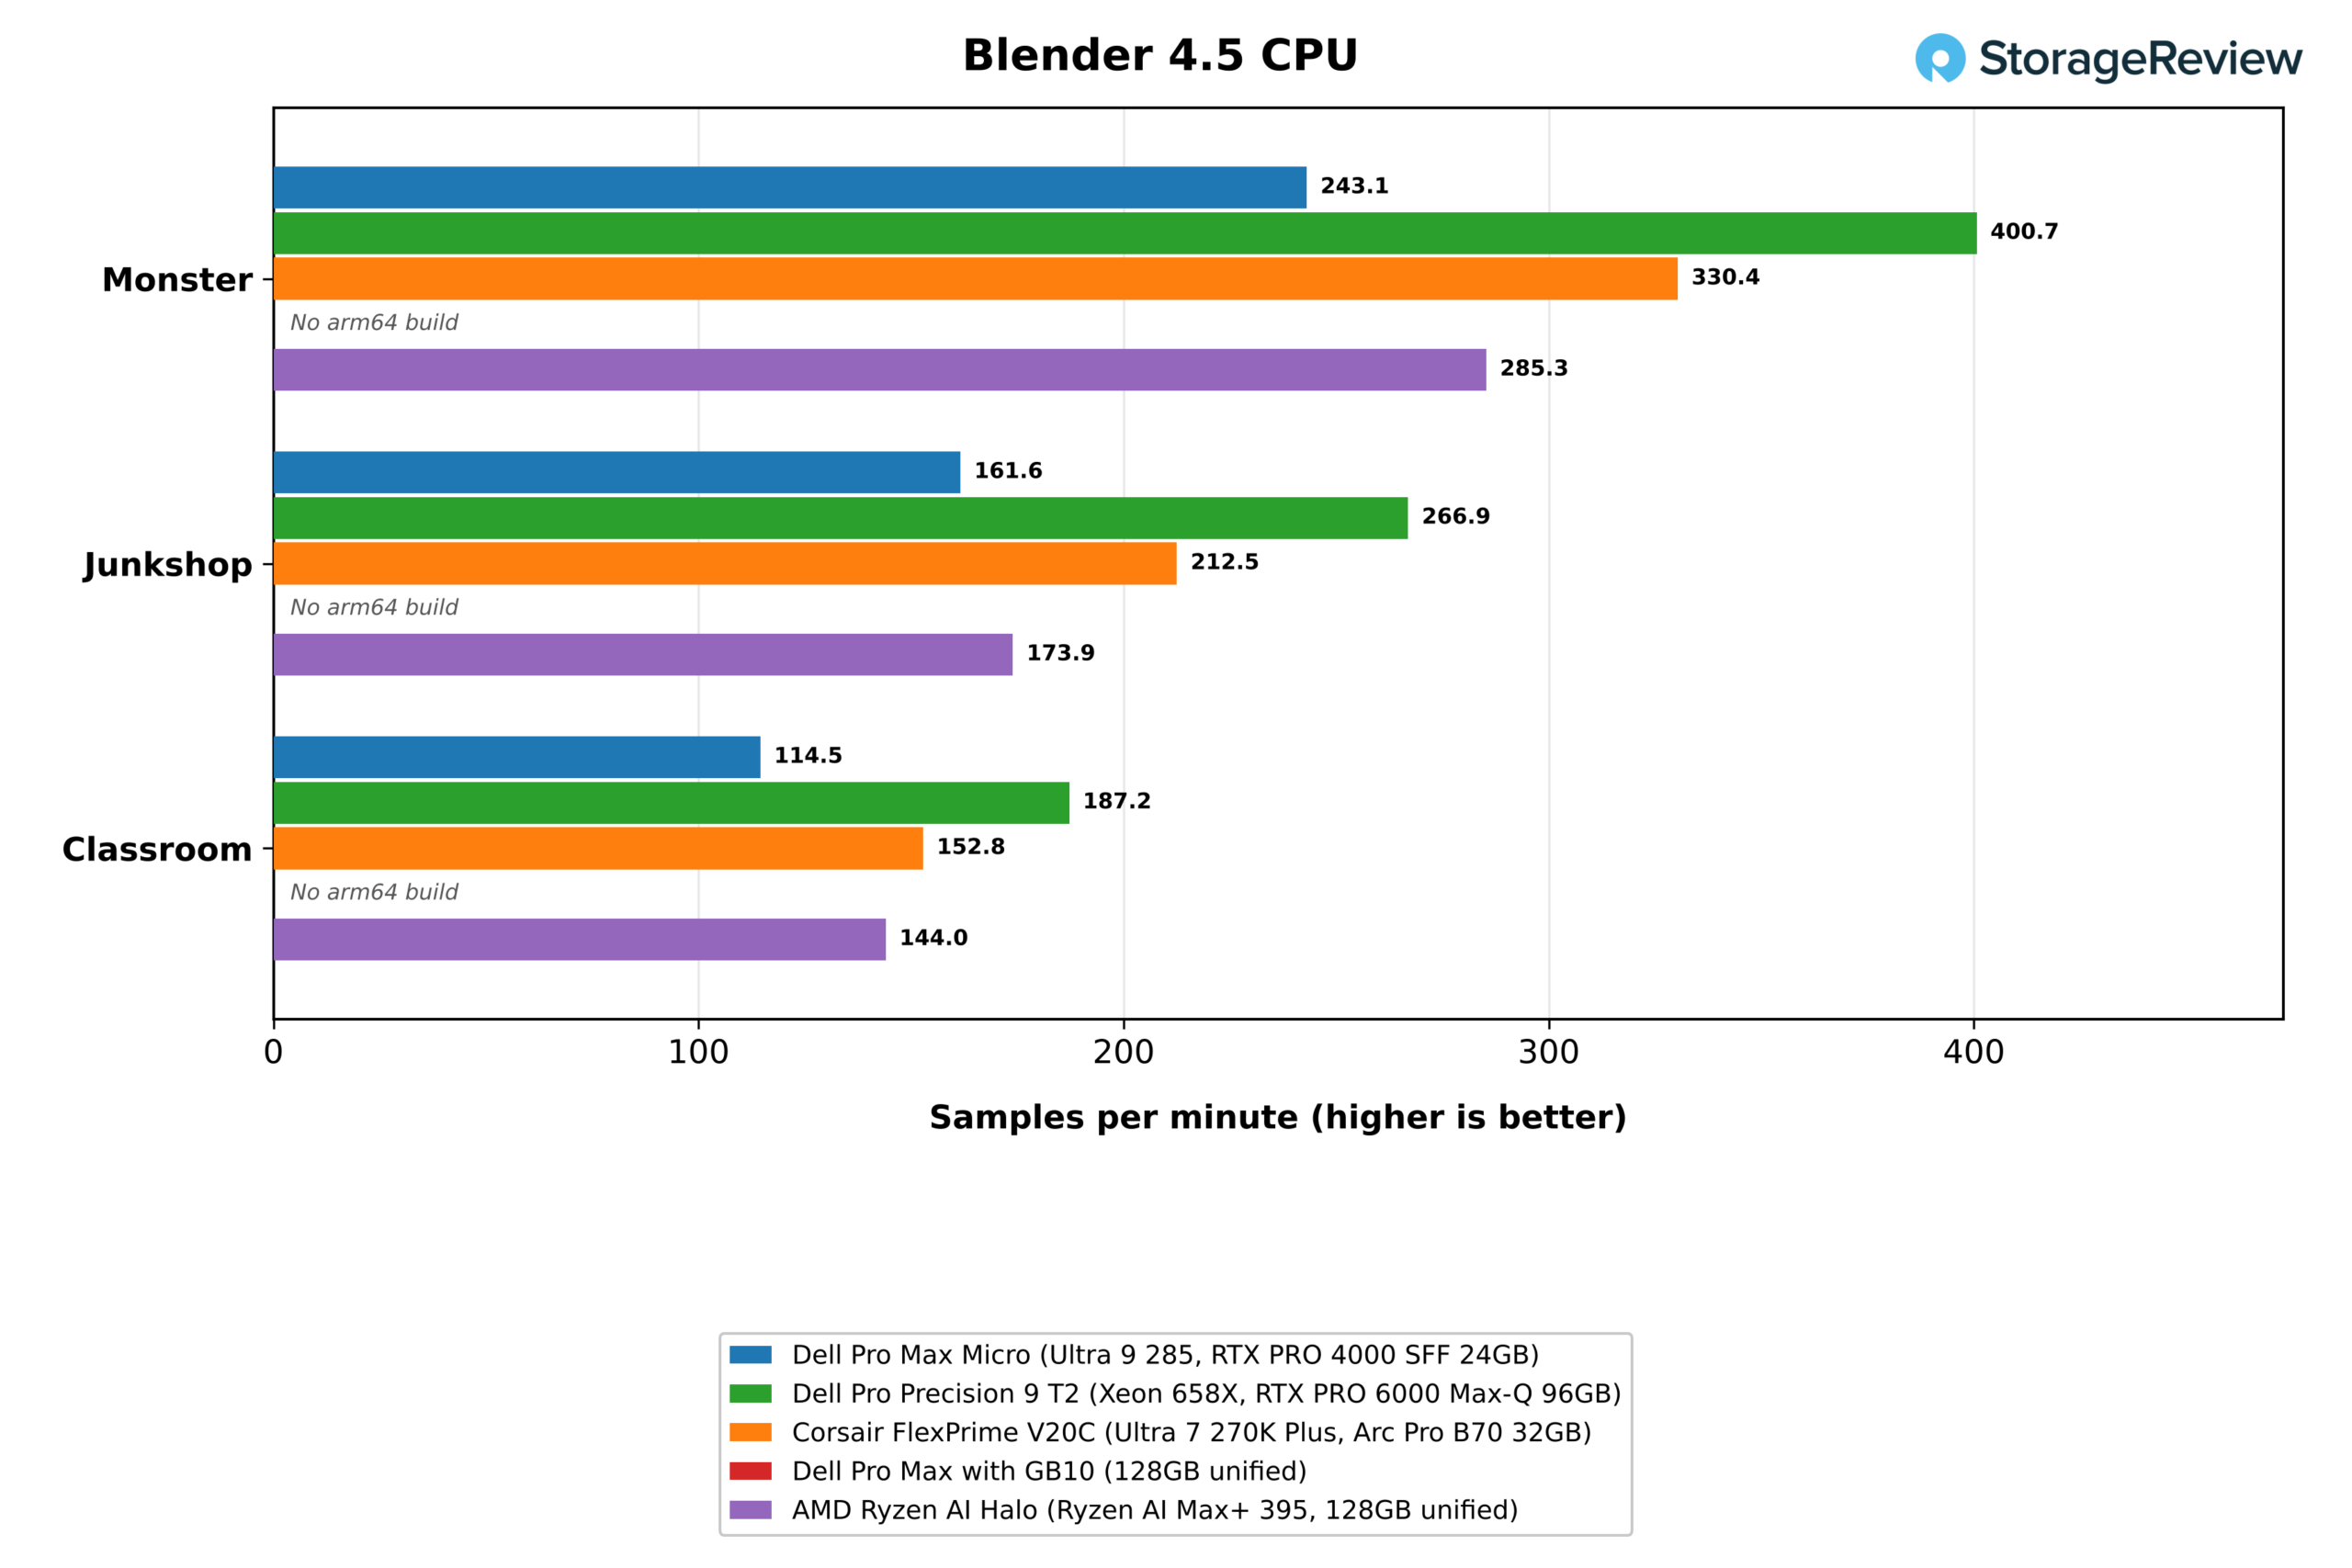
The T2 scales the multi-thread results as expected for a 24-core, 48-thread Xeon in a tower. It scored 285.1 GIPS in 7-Zip, 74 percent ahead of the Micro, delivered 63 to 65 percent more Blender throughput, and finished the LLVM build in 106 seconds against 173. Per-core speed runs the other way, with the Micro’s Core Ultra 9 285 ahead of the Xeon 658X by 18 percent in one-thread 7-Zip and 14 percent in one-thread Stockfish, and 18 to 20 percent quicker in the single-thread Python tests.
Stockfish, primesieve, and Python
| Test | Dell Pro Max Micro (Ultra 9 285, RTX PRO 4000 SFF 24GB) | Dell Pro Precision 9 T2 (Xeon 658X, RTX PRO 6000 Max-Q 96GB) | Corsair FlexPrime V20C (Ultra 7 270K Plus, Arc Pro B70 32GB) | Dell Pro Max with GB10 (128GB unified) | AMD Ryzen AI Halo (Ryzen AI Max+ 395, 128GB unified) |
|---|---|---|---|---|---|
| Stockfish, one thread (Mnps) | 2.02 | 1.77 | 2.08 | 1.66 | 2.15 |
| Stockfish, all threads (Mnps) | 31.58 | 45.44 | 40.55 | 23.86 | 38.74 |
| primesieve to 10^12, all threads (s, lower is better) | 8.72 | 7.51 | 6.48 | 9.16 | 6.29 |
| primesieve to 10^11, one thread (s, lower is better) | 9.07 | 9.66 | 9.03 | 12.32 | 6.76 |
| PyPerformance go (ms, lower is better) | 57.8 | 72.1 | 56.0 | 85.5 | 69.1 |
| PyPerformance nbody (ms, lower is better) | 38.9 | 47.3 | 36.3 | 55.0 | 43.1 |
All-thread Stockfish reached 31.58 Mnps on the Micro, behind the T2 at 45.44, the V20C at 40.55, and the Halo at 38.74, and 32 percent ahead of the GB10, and primesieve to 10^12 finished in 8.72 seconds against 7.51, 6.48, 9.16, and 6.29 on the Halo. One-thread results between the two Core Ultra systems were within 3 percent in Stockfish and level in primesieve at 9.07 and 9.03 seconds. The single-thread Python tests ran 3 to 7 percent behind the V20C and finished about 30 percent faster than on the Arm-based GB10.
GROMACS and OpenBLAS
| Test | Dell Pro Max Micro (Ultra 9 285, RTX PRO 4000 SFF 24GB) | Dell Pro Precision 9 T2 (Xeon 658X, RTX PRO 6000 Max-Q 96GB) | Corsair FlexPrime V20C (Ultra 7 270K Plus, Arc Pro B70 32GB) | Dell Pro Max with GB10 (128GB unified) | AMD Ryzen AI Halo (Ryzen AI Max+ 395, 128GB unified) |
|---|---|---|---|---|---|
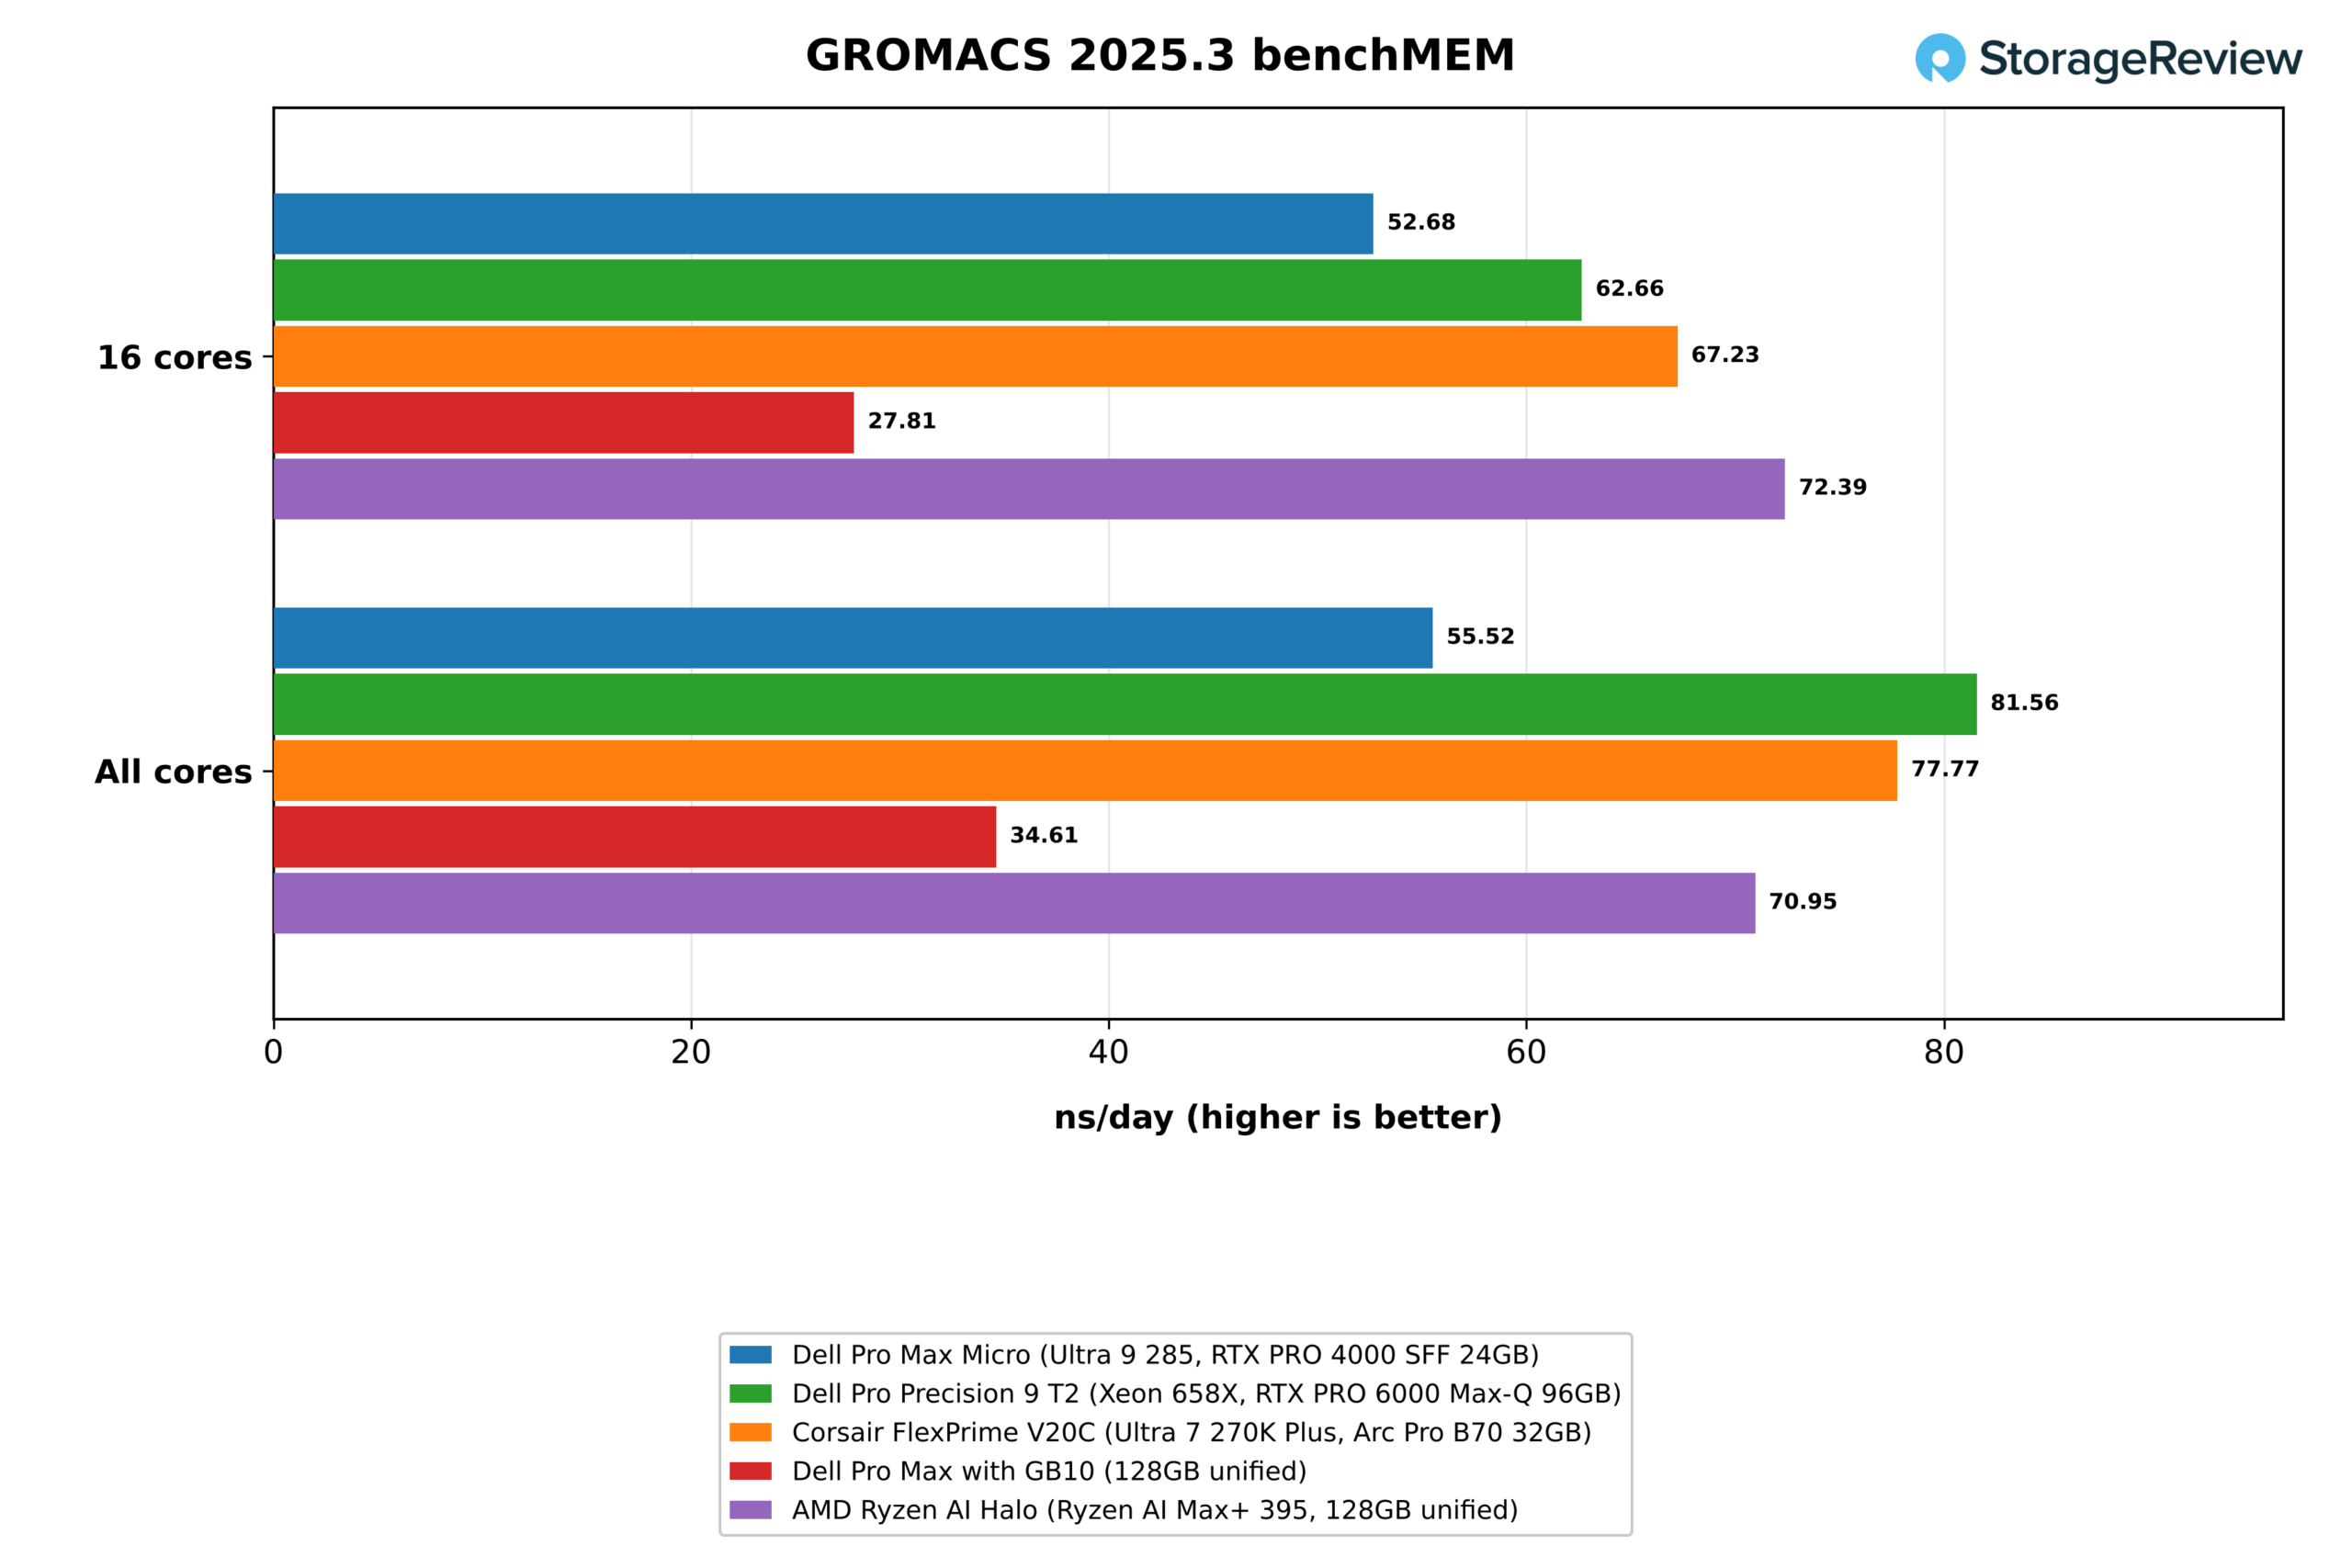
| GROMACS benchMEM, 16 cores (ns/day) | 52.68 | 62.66 | 67.23 | 27.81 | 72.39 |
| GROMACS benchMEM, all cores (ns/day) | 55.52 | 81.56 | 77.77 | 34.61 | 70.95 |
| OpenBLAS DGEMM, all cores (GFLOPS) | 791.6 | 2,318.9 | 1,100.0 | 418.0 | 1,610.3 |
| OpenBLAS LU solve N=20000, all cores (GFLOPS) | 717.0 | 1,615.8 | 938.6 | 393.0 | 1,391.3 |
| Memory latency, 4KiB pages (ns, lower is better) | 129.0 | 143.8 | 105.2 | 123.8 | 162.2 |
GROMACS benchMEM ran at 52.68 ns/day on 16 cores and 55.52 on all 24, which is 22 and 29 percent behind the V20C and 89 and 60 percent ahead of the GB10. OpenBLAS DGEMM reached 791.6 GFLOPS on all cores, compared with 1,100.0 on the V20C and 418.0 on the GB10; the T2’s Xeon, with AVX-512 and four memory channels, reached 2,318.9. GROMACS was also the hottest test in the suite for this chassis, and the small gain from 16 cores to 24 is consistent with a processor running at its thermal limit. Memory latency on 4KiB pages measured 129.0ns, against 105.2ns on the V20C and 123.8ns on the GB10.
The Halo posted the fastest 16-core GROMACS result in the group at 72.39 ns/day, 37 percent ahead of the Micro, and ran at 70.95 ns/day on all 32 threads, behind the T2 at 81.56 and the V20C at 77.77. It reached 1,610.3 GFLOPS in OpenBLAS DGEMM, about twice the Micro’s rate and second to the T2, and its memory latency was the highest in the group at 162.2ns.
Server and HPC Workloads
These results come from our benchmark harness and server suite, which run on Linux only. They treat the Micro as a general compute node that compiles, compresses, serves web and cache requests, runs analytics queries, and solves a CFD case. Each system runs a different Linux distribution and compiler except the Micro, the T2, and the V20C, which share Ubuntu 26.04.1 and give the most direct comparison.
| Phoronix Test Suite and y-cruncher (higher is better unless noted) | Dell Pro Max Micro (Ultra 9 285, RTX PRO 4000 SFF 24GB) | Dell Pro Precision 9 T2 (Xeon 658X, RTX PRO 6000 Max-Q 96GB) | Corsair FlexPrime V20C (Ultra 7 270K Plus, Arc Pro B70 32GB) | Dell Pro Max with GB10 (128GB unified) | AMD Ryzen AI Halo (Ryzen AI Max+ 395, 128GB unified) |
|---|---|---|---|---|---|
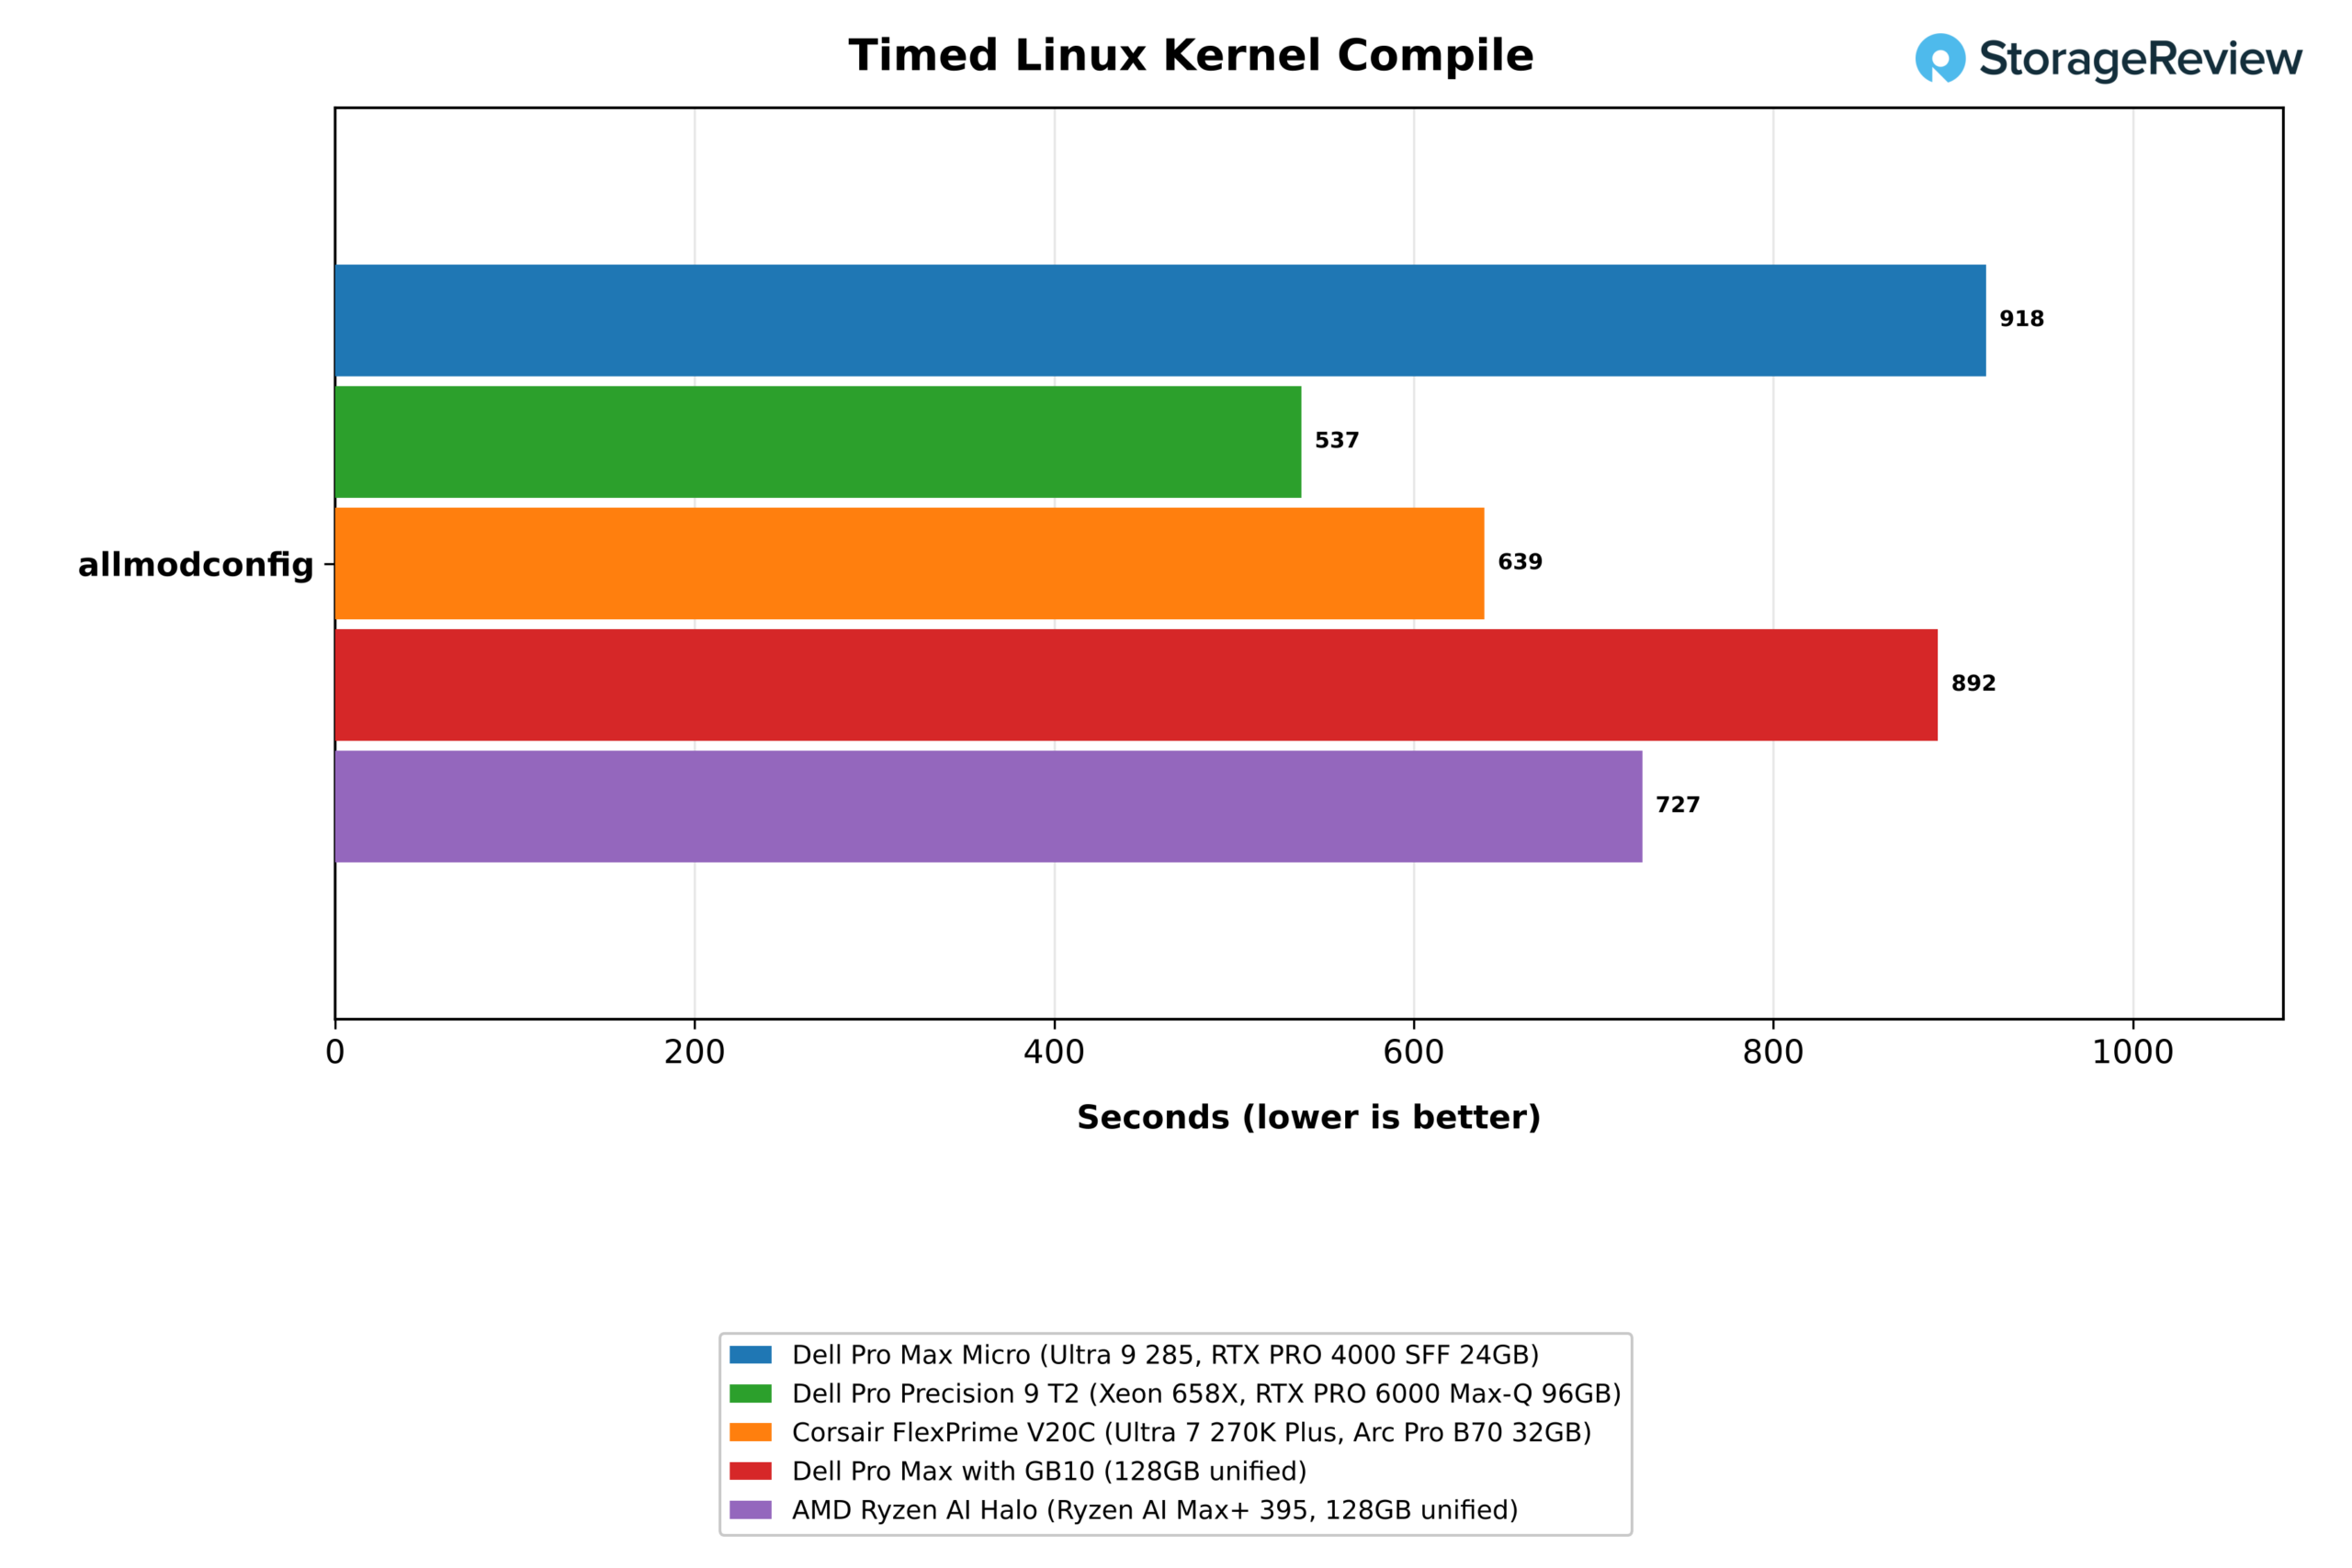
| Timed Linux kernel compile, allmodconfig (s, lower is better) | 918 | 537 | 639 | 892 | 727 |
| 7-Zip compression rating, all threads (MIPS) | 150,543 | 264,940 | 186,668 | 154,634 | 178,530 |
| 7-Zip decompression rating, all threads (MIPS) | 88,641 | 195,348 | 128,723 | 106,148 | 143,464 |
| 7-Zip compression rating, one thread (MIPS) | 9,351 | 9,100 | 10,260 | 7,474 | 8,019 |
| OpenSSL AES-256-GCM, all threads (GB/s) | 110.0 | 371.2 | 171.4 | 97.1 | 298.6 |
| nginx, 1,000 connections (requests/s) | 155,203 | 323,567 | 225,708 | 114,909 | 223,433 |
| nginx, 4,000 connections (requests/s) | 109,352 | 244,008 | 155,146 | 101,613 | 190,454 |
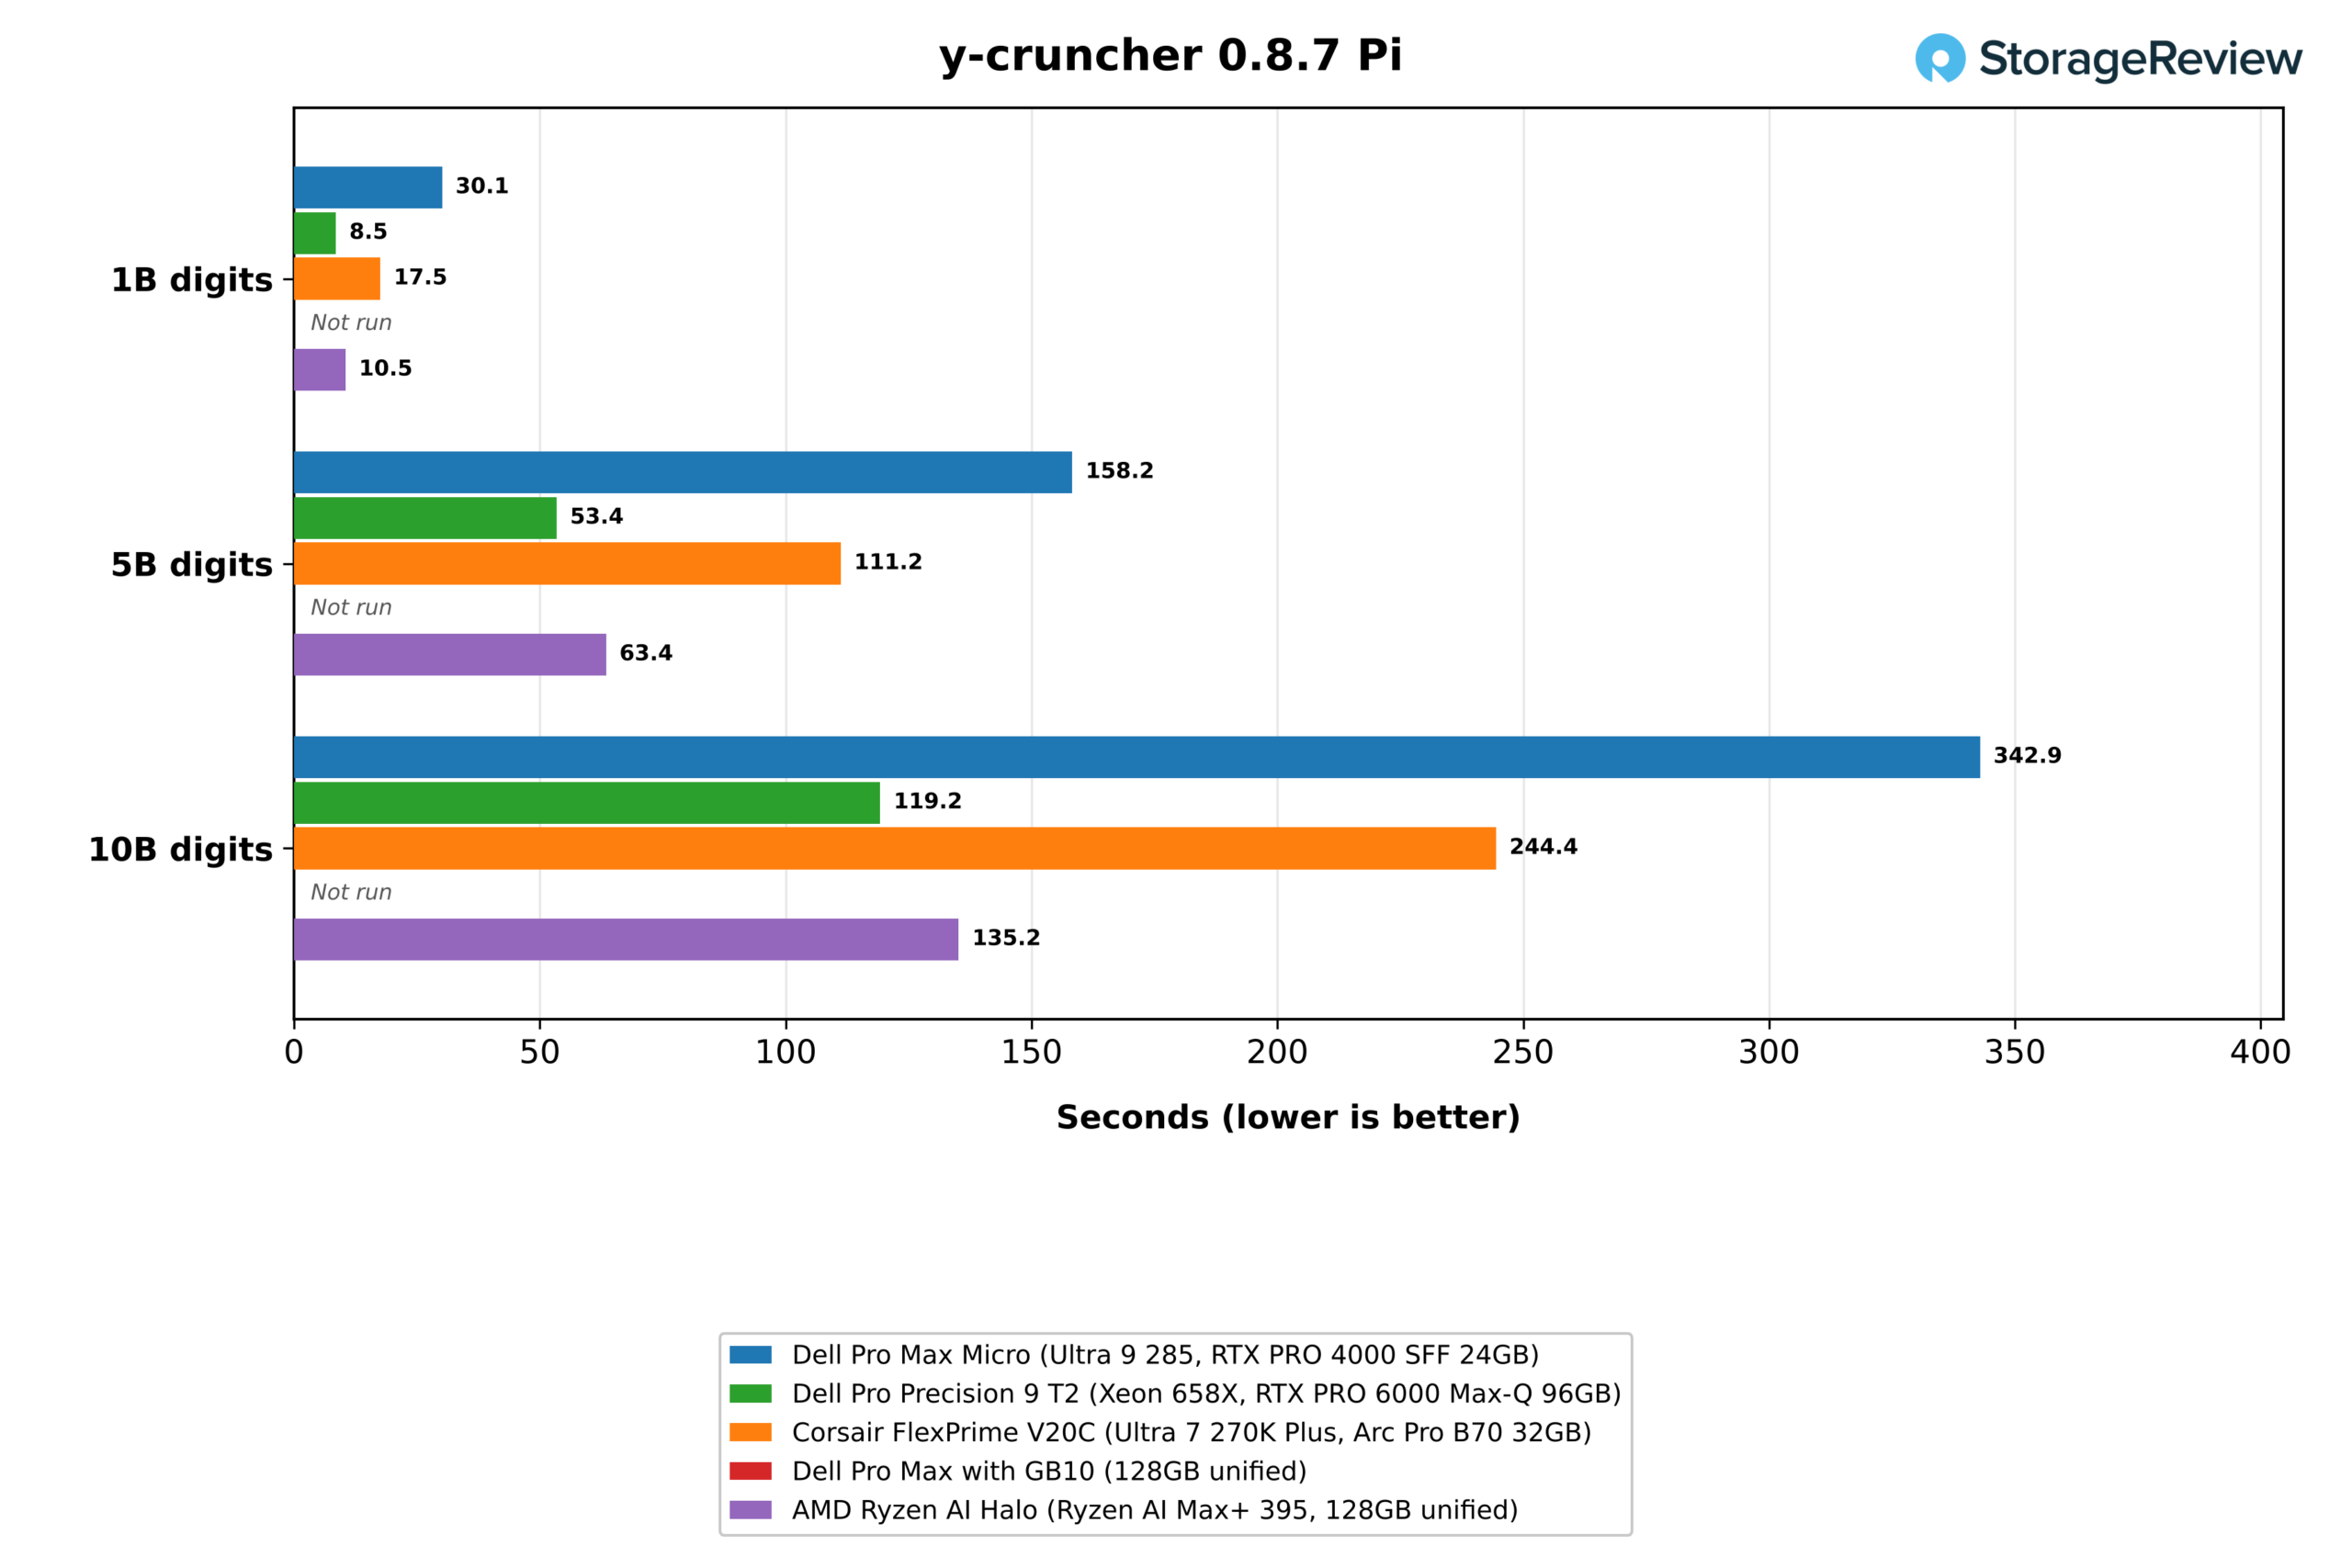
| y-cruncher Pi, 1B digits (s, lower is better) | 30.10 | 8.51 | 17.54 | Not run | 10.46 |
| y-cruncher Pi, 5B digits (s, lower is better) | 158.24 | 53.40 | 111.17 | Not run | 63.45 |
| y-cruncher Pi, 10B digits (s, lower is better) | 342.87 | 119.21 | 244.44 | Not run | 135.18 |
The Micro compiled the Linux kernel in 918 seconds, 3 percent behind the GB10 at 892 and well behind the Halo at 727 and the V20C at 639. All-thread 7-Zip compression landed within 3 percent of the GB10, and the Micro led that system by 25 percent with one thread, by 13 percent in OpenSSL AES-256-GCM, and by 35 percent in nginx at 1,000 connections. The V20C and the Halo were both faster in the all-thread tests, and the T2 led every all-thread row, compiling the kernel in 537 seconds and running OpenSSL at 371.2GB/s against the Micro’s 110.0GB/s.
In y-cruncher, the Micro computed five billion digits of Pi in 158.24 seconds, against 111.17 on the V20C and 63.45 on the Halo; ten billion digits took 342.87 seconds, against 244.44 and 135.18. The test is sensitive to memory bandwidth and vector width, and the Halo brings AVX-512 and a wider memory bus, whereas the Micro has two channels of DDR5-6400. The T2 was fastest at 53.40 and 119.21 seconds, and the GB10 has not run y-cruncher.
| Server suite (higher is better unless noted) | Dell Pro Max Micro (Ultra 9 285, RTX PRO 4000 SFF 24GB) | Dell Pro Precision 9 T2 (Xeon 658X, RTX PRO 6000 Max-Q 96GB) | Corsair FlexPrime V20C (Ultra 7 270K Plus, Arc Pro B70 32GB) | Dell Pro Max with GB10 (128GB unified) | AMD Ryzen AI Halo (Ryzen AI Max+ 395, 128GB unified) |
|---|---|---|---|---|---|
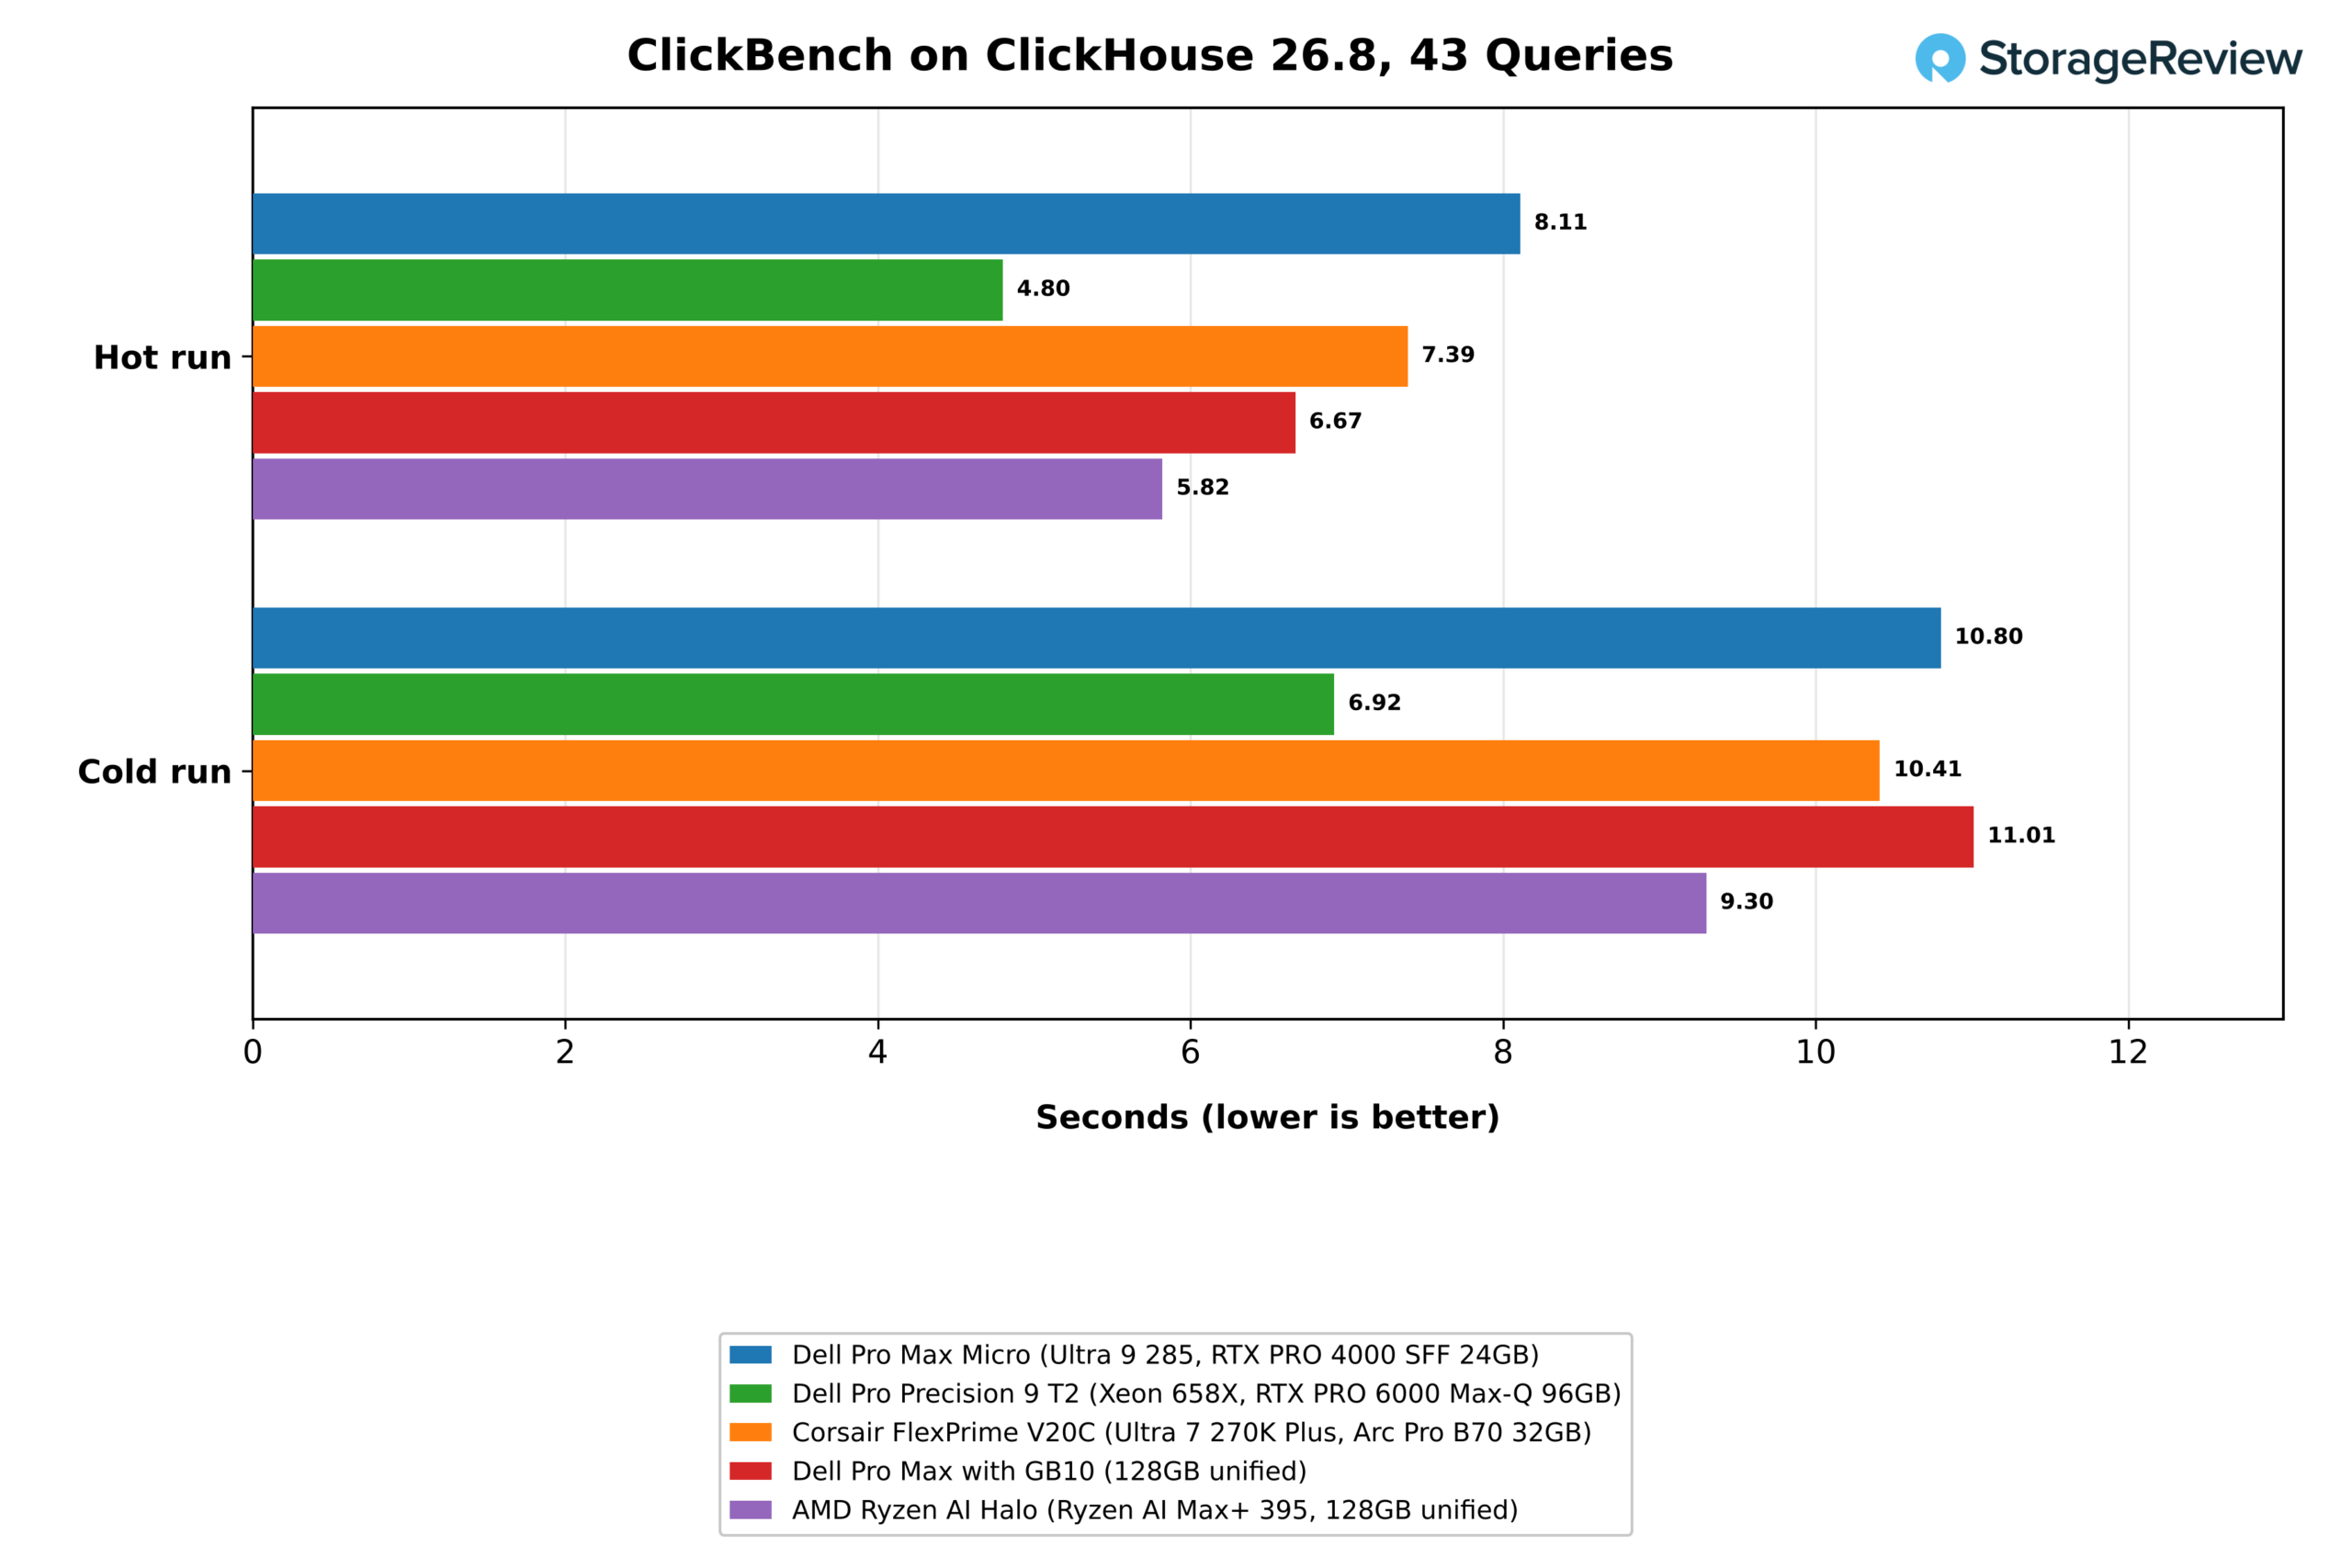
| ClickBench hot run, 43 queries (s, lower is better) | 8.11 | 4.80 | 7.39 | 6.67 | 5.82 |
| ClickBench cold run, 43 queries (s, lower is better) | 10.80 | 6.92 | 10.41 | 11.01 | 9.30 |
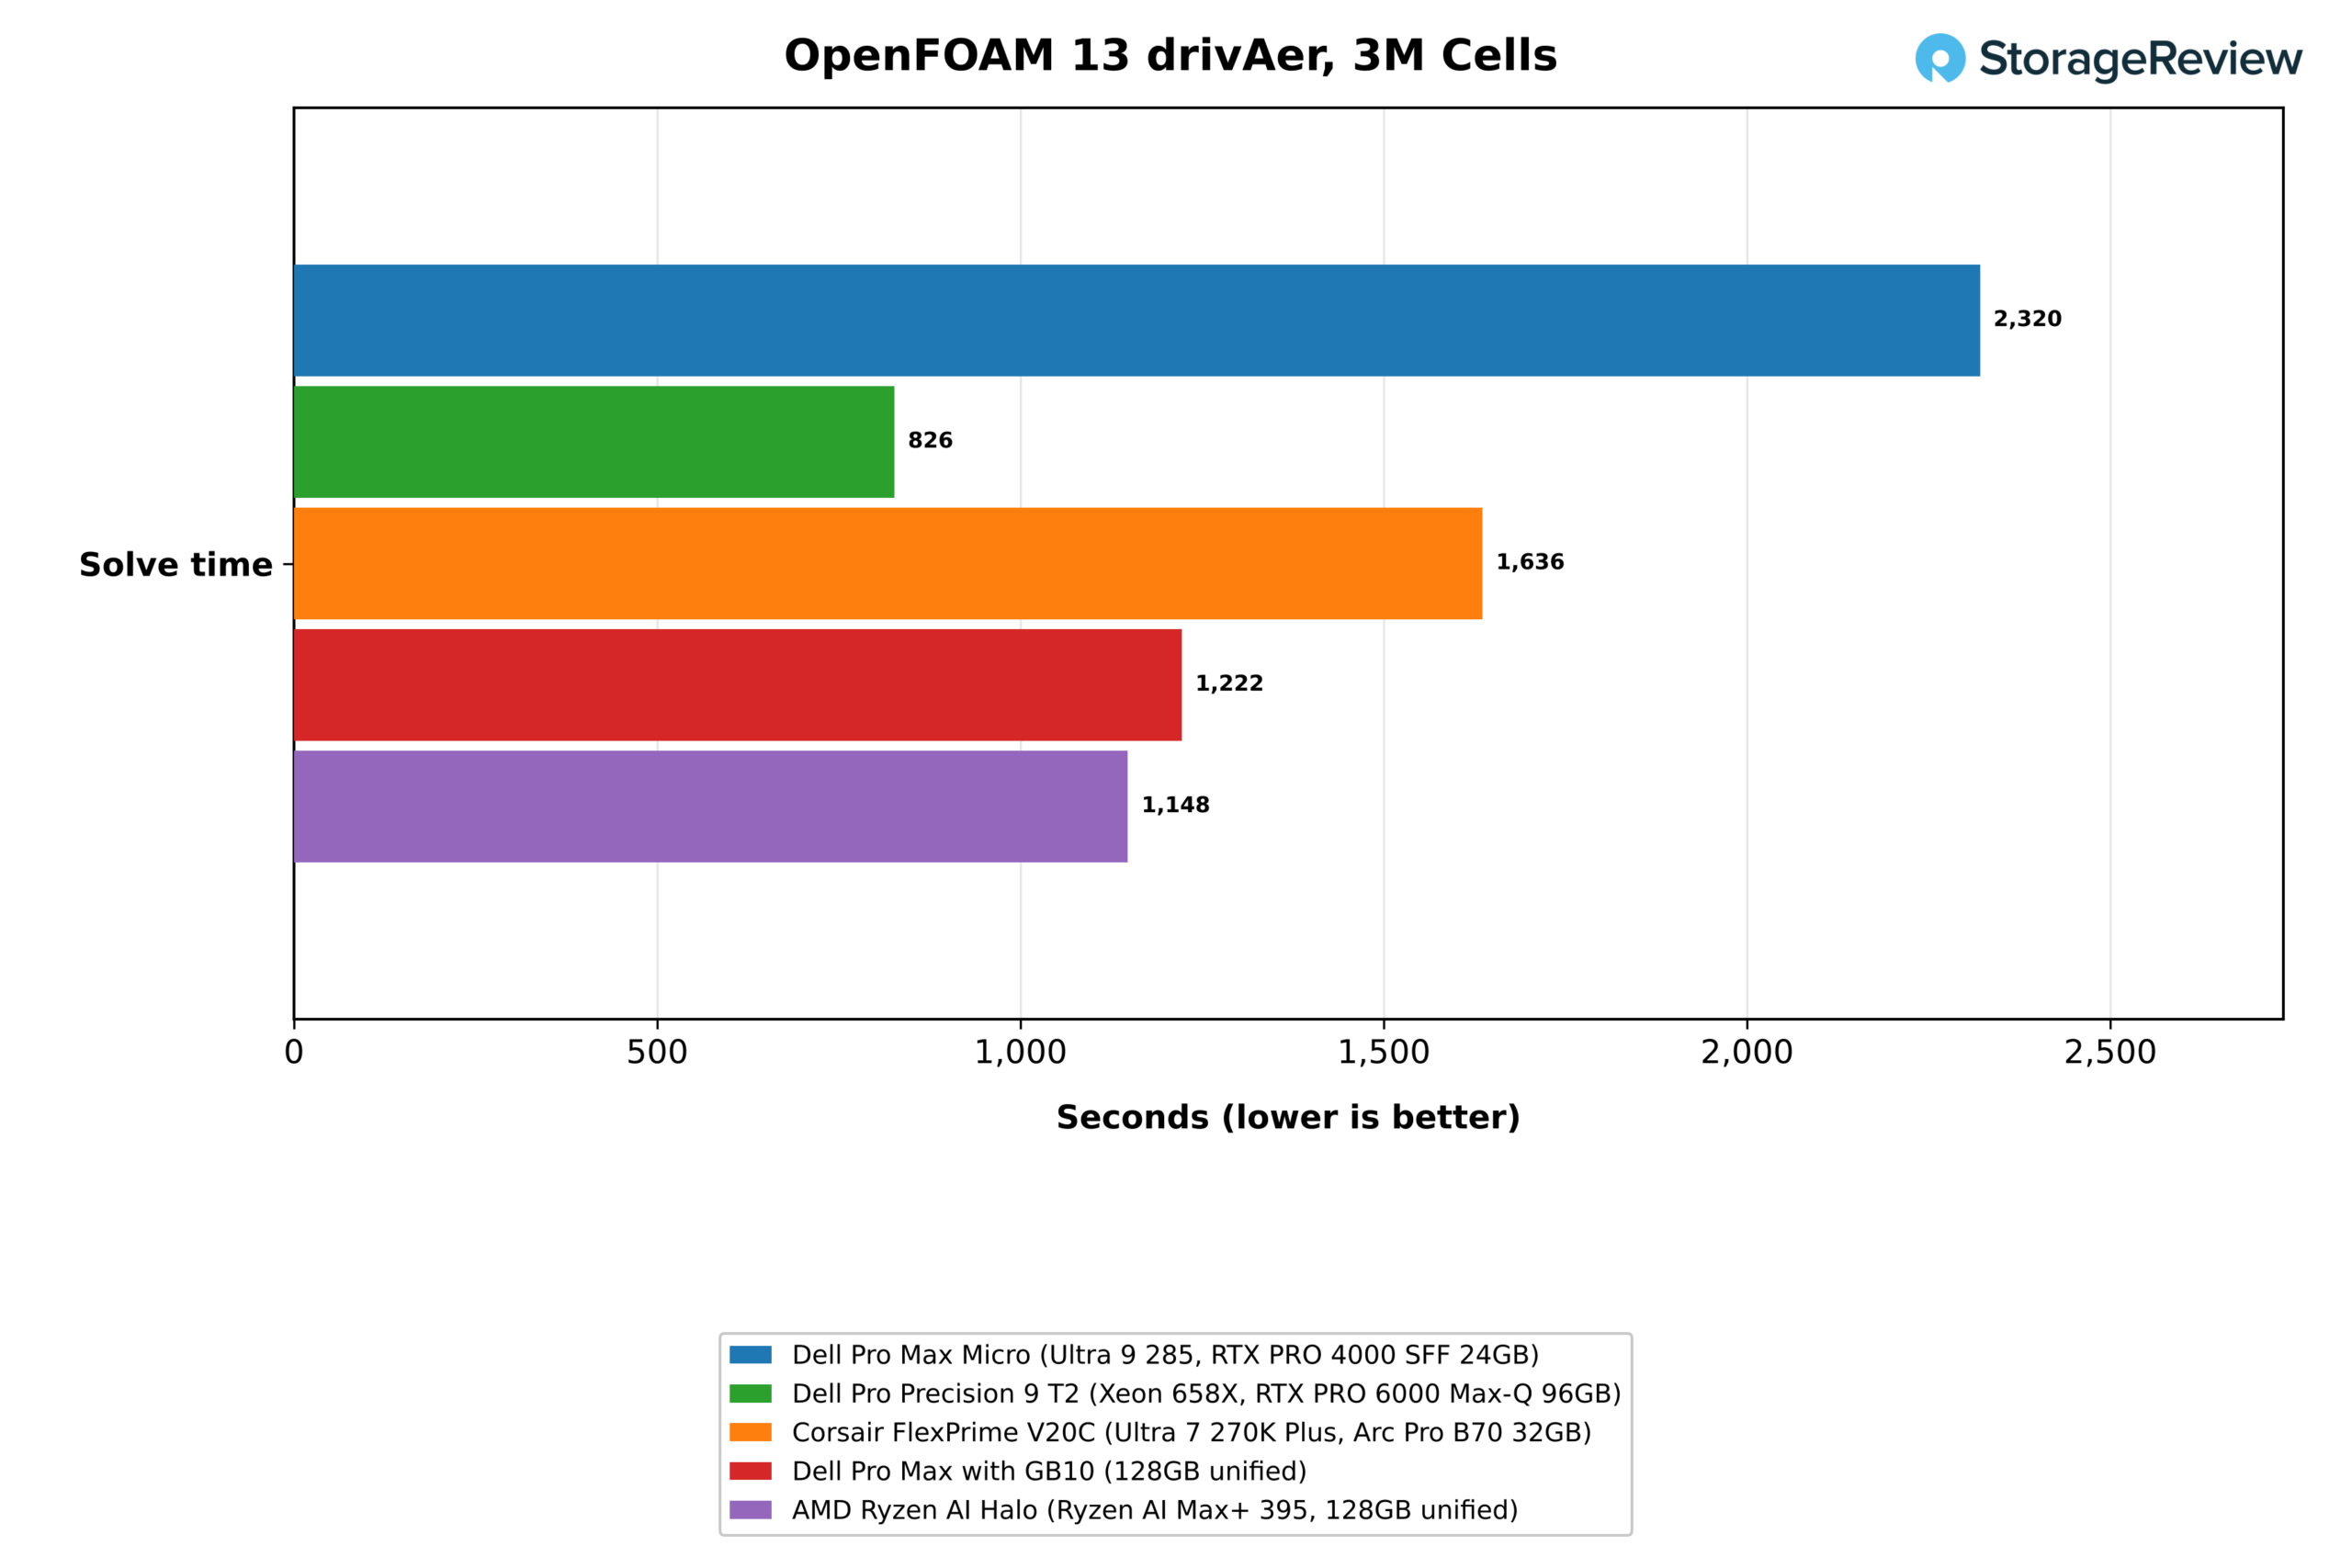
| OpenFOAM drivAer, 3M cells, solve time (s, lower is better) | 2,320 | 826 | 1,636 | 1,222 | 1,148 |
| STREAM Triad (MB/s) | 65,802 | 141,832 | 68,252 | 121,313 | 114,007 |
| Valkey cache, SET (requests/s) | 1,389,084 | 914,832 | 1,852,556 | 810,246 | 1,211,538 |
| Valkey cache, GET (requests/s) | 1,398,409 | 991,576 | 1,866,031 | 884,644 | 1,271,481 |
Memory bandwidth explains most of the server suite results. STREAM Triad measured 65.8GB/s on the Micro’s two DDR5 channels, close to the V20C at 68.3GB/s and about half of the 121.3GB/s and 114.0GB/s on the GB10 and the Halo, with the T2 at 141.8GB/s. The OpenFOAM drivAer case, a 3-million-cell solve, took 2,320 seconds on the Micro against 826 on the T2, 1,636 on the V20C, 1,222 on the GB10, and 1,148 on the Halo, and the ClickBench hot run took 8.11 seconds against 4.80, 7.39, 6.67, and 5.82.
Valkey leans on per-core speed, and the Micro handled 1.39 million SET and 1.40 million GET requests per second in the cache profile. That is 25 percent under the V20C, 15 and 10 percent ahead of the Halo’s 1.21 million and 1.27 million, 71 and 58 percent ahead of the GB10’s 810K and 885K, and 52 and 41 percent ahead of the T2’s Xeon at 915K and 992K. A workstation that also hosts a cache or a small database beside the model server benefits from the Core Ultra’s per-core speed.
GPU Encoding
For GPU encoding, FFmpeg 8.1 with NVENC ran the suite’s 4K Big Buck Bunny clip to HEVC at 123 fps on the RTX PRO 4000 SFF. The T2 and the GB10 ran the same encoder at 124 and 134 fps, and the V20C reached 154 fps through Intel Quick Sync and the Halo reached 204 fps through VAAPI, each with different encoder settings, so those two figures are reference points more than rankings. A newer FFmpeg build in the suite requires NVIDIA driver 610.00 or later for NVENC and did not run on the 595.99.02 driver installed here.
Thermals Under Load
| Dell Pro Max Micro | CPU Max (C) | CPU Mean (C) | GPU Max (C) | GPU Mean (C) |
|---|---|---|---|---|
| 7-Zip | 101 | 78.7 | 32 | 31.7 |
| Blender | 98 | 82.3 | 35 | 33.7 |
| LLVM build | 100 | 79.4 | 33 | 33.0 |
| OpenBLAS | 104 | 83.5 | 32 | 32.0 |
| GROMACS | 105 | 89.3 | 33 | 32.6 |
| Coding agent | 83 | 70.0 | 69 | 62.3 |
| LLM serving | 76 | 73.5 | 73 | 67.2 |
| RAG at scale | 97 | 79.6 | 73 | 71.7 |
| Image generation | 85 | 72.0 | 72 | 68.5 |
The 285 ran against its thermal ceiling in every all-core test. CPU package temperature peaked at 98C in Blender, 100C in the LLVM build, 101C in 7-Zip, 104C in OpenBLAS, and 105C in GROMACS, with means between 79C and 89C across those tests. That is the cost of running a 65W desktop chip at 85W in a 2.9-liter chassis, and it lines up with the multi-thread gap to the tower in the CPU results. The processor idled at about 40C between tests.
The graphics card ran much cooler, as the RTX PRO 4000 SFF idled at 32C and peaked at 73C during LLM serving and the million-passage RAG ingest, averaging 71.7C across a 57-minute run. Image generation held it at 72C, and the coding agent at 69C. The 70W card has thermal headroom in this chassis even when the CPU does not, and the SSD stayed at 63C or below through the 74-minute storage test.
Storage Performance
| fio, 25GiB footprint (higher is better) | Dell Pro Max Micro (Ultra 9 285, RTX PRO 4000 SFF 24GB) | Dell Pro Precision 9 T2 (Xeon 658X, RTX PRO 6000 Max-Q 96GB) | Corsair FlexPrime V20C (Ultra 7 270K Plus, Arc Pro B70 32GB) | Dell Pro Max with GB10 (128GB unified) | AMD Ryzen AI Halo (Ryzen AI Max+ 395, 128GB unified) |
|---|---|---|---|---|---|
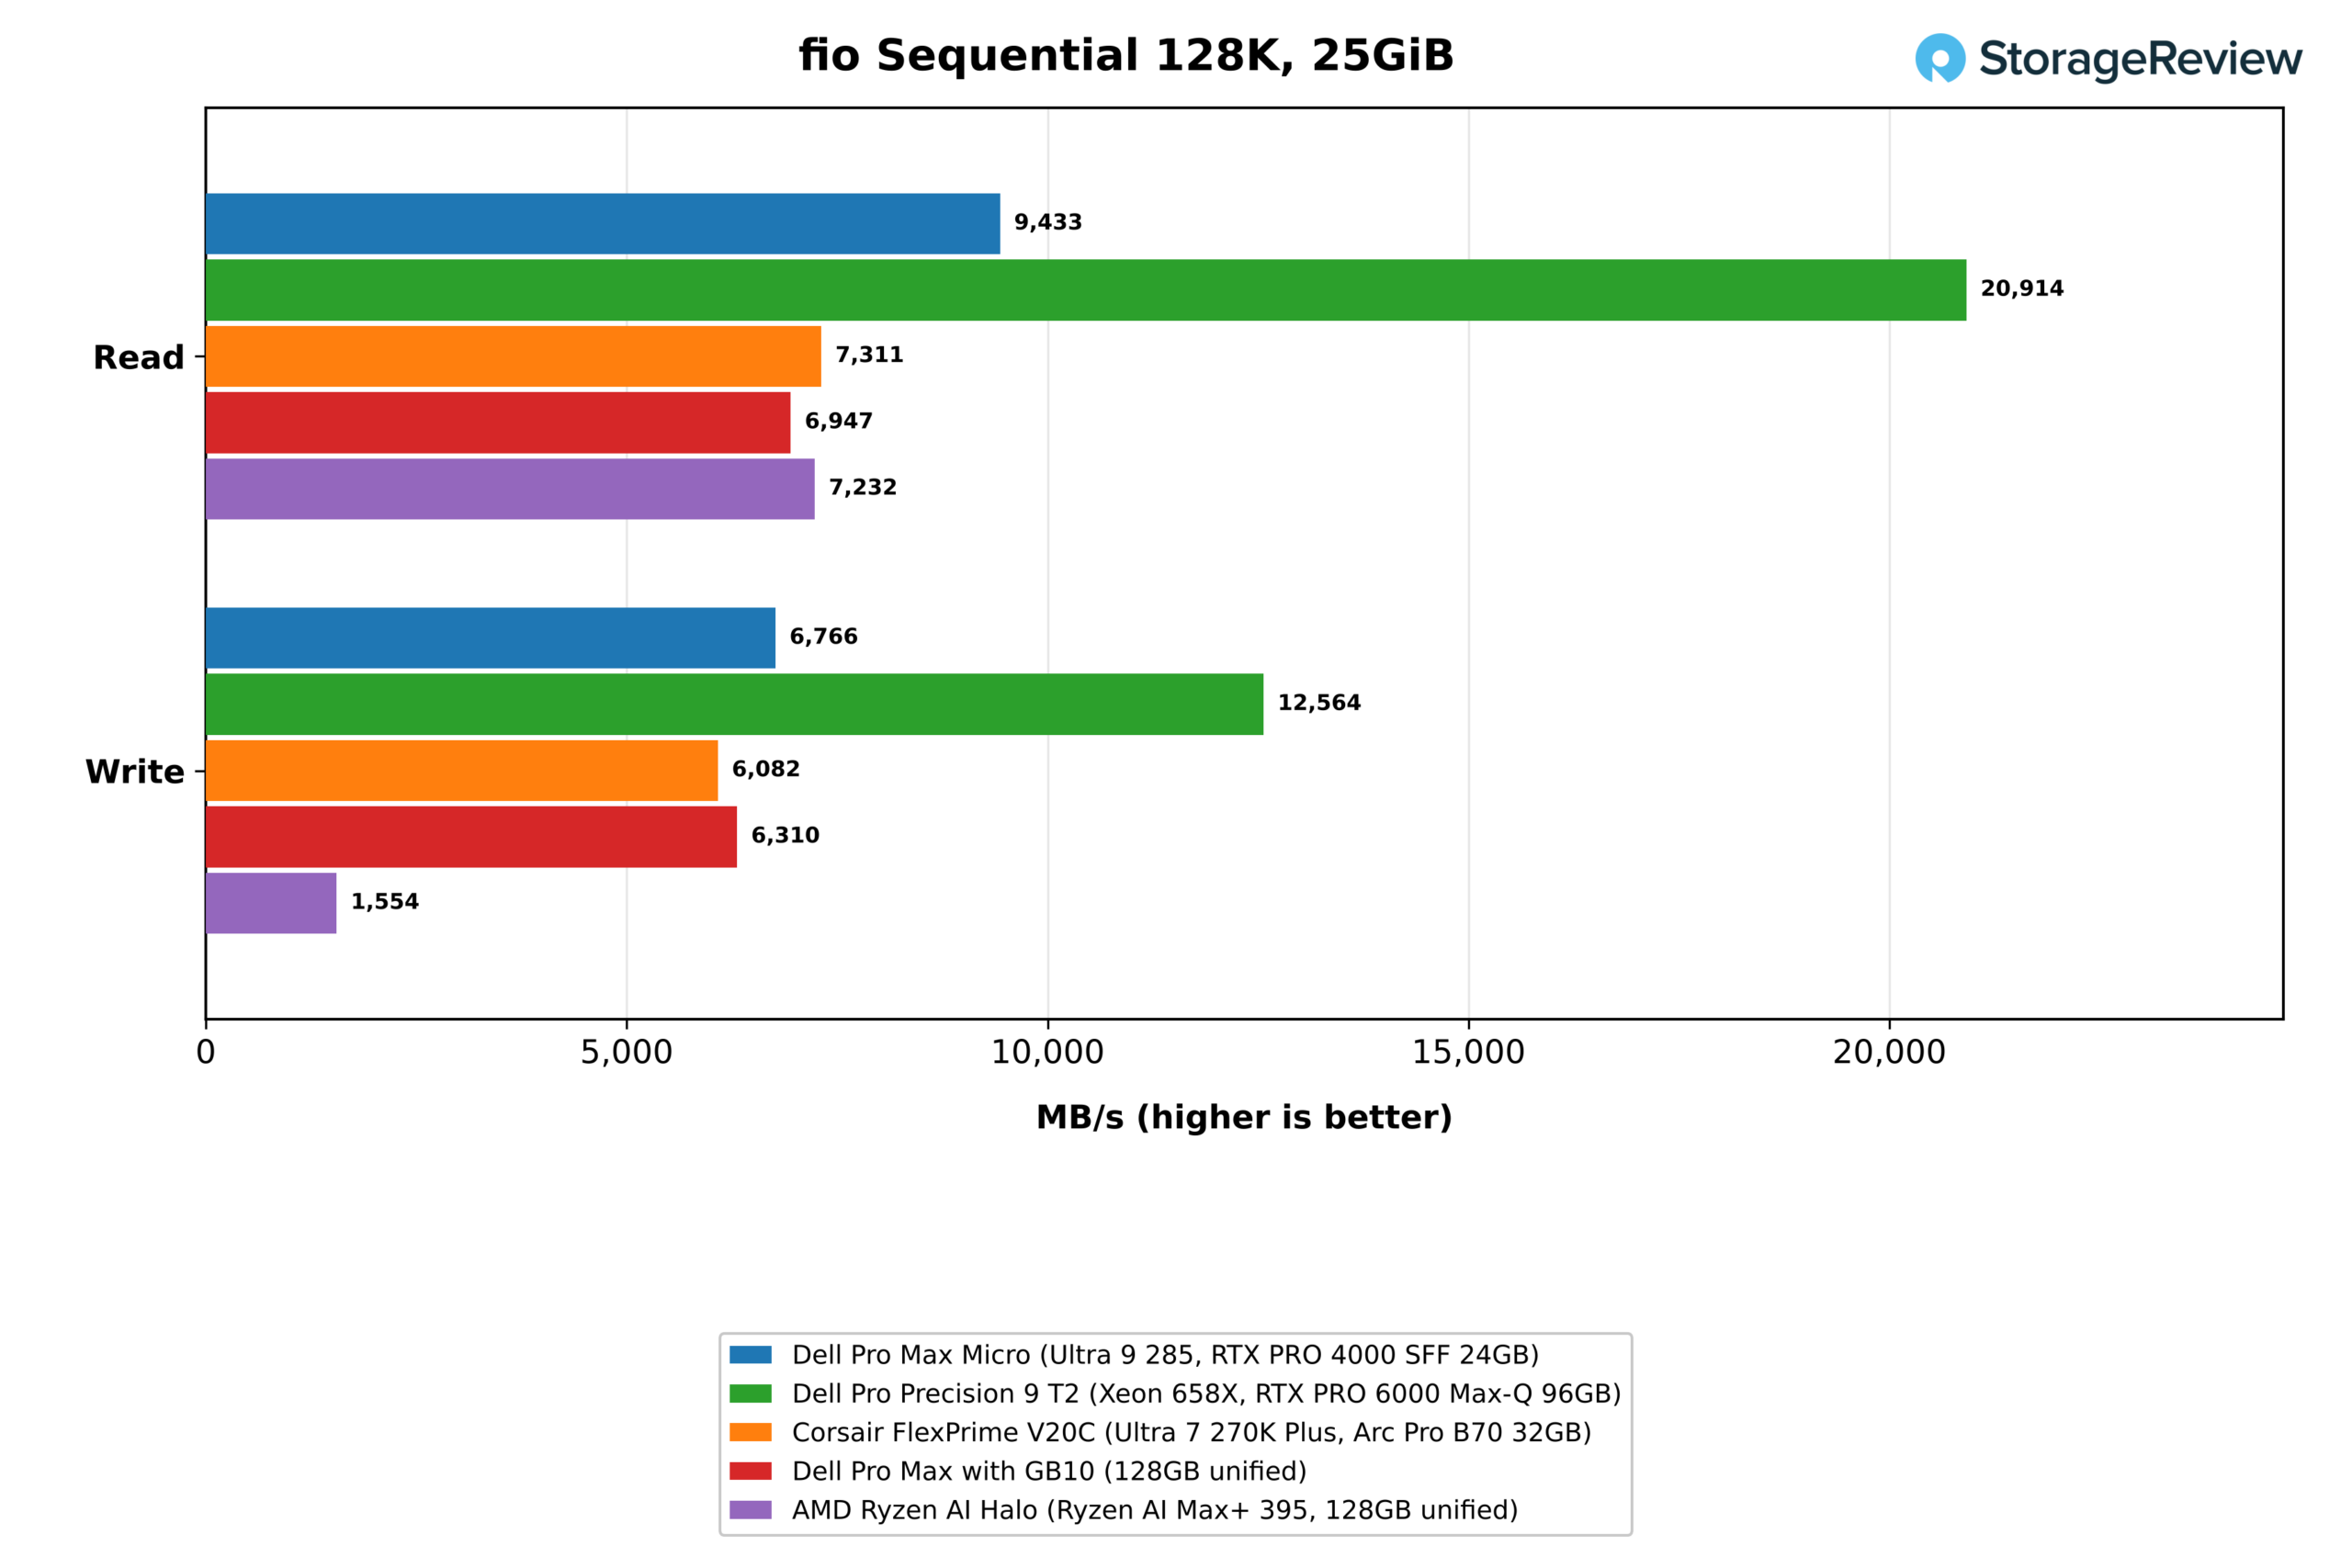
| Sequential read 128K (MB/s) | 9,433 | 20,914* | 7,311 | 6,947 | 7,232 |
| Sequential write 128K (MB/s) | 6,766 | 12,564 | 6,082 | 6,310 | 1,554* |
| Random read 4K, peak (IOPS) | 2,084,437 | 3,214,066 | 1,184,970 | 932,210 | 1,197,992 |
| Random write 4K, peak (IOPS) | 1,028,079* | 2,353,766 | 184,231 | 997,758 | 121,285* |
| Random read 4K, QD32 x 4 jobs (IOPS) | 1,386,889 | 1,394,262 | 1,184,970 | 754,896 | 1,001,941 |
| Random write 4K, QD32 x 4 jobs (IOPS) | 1,028,079* | 1,175,233 | 178,312 | 946,264 | 121,285* |
*Flagged by the suite for run-to-run variance.
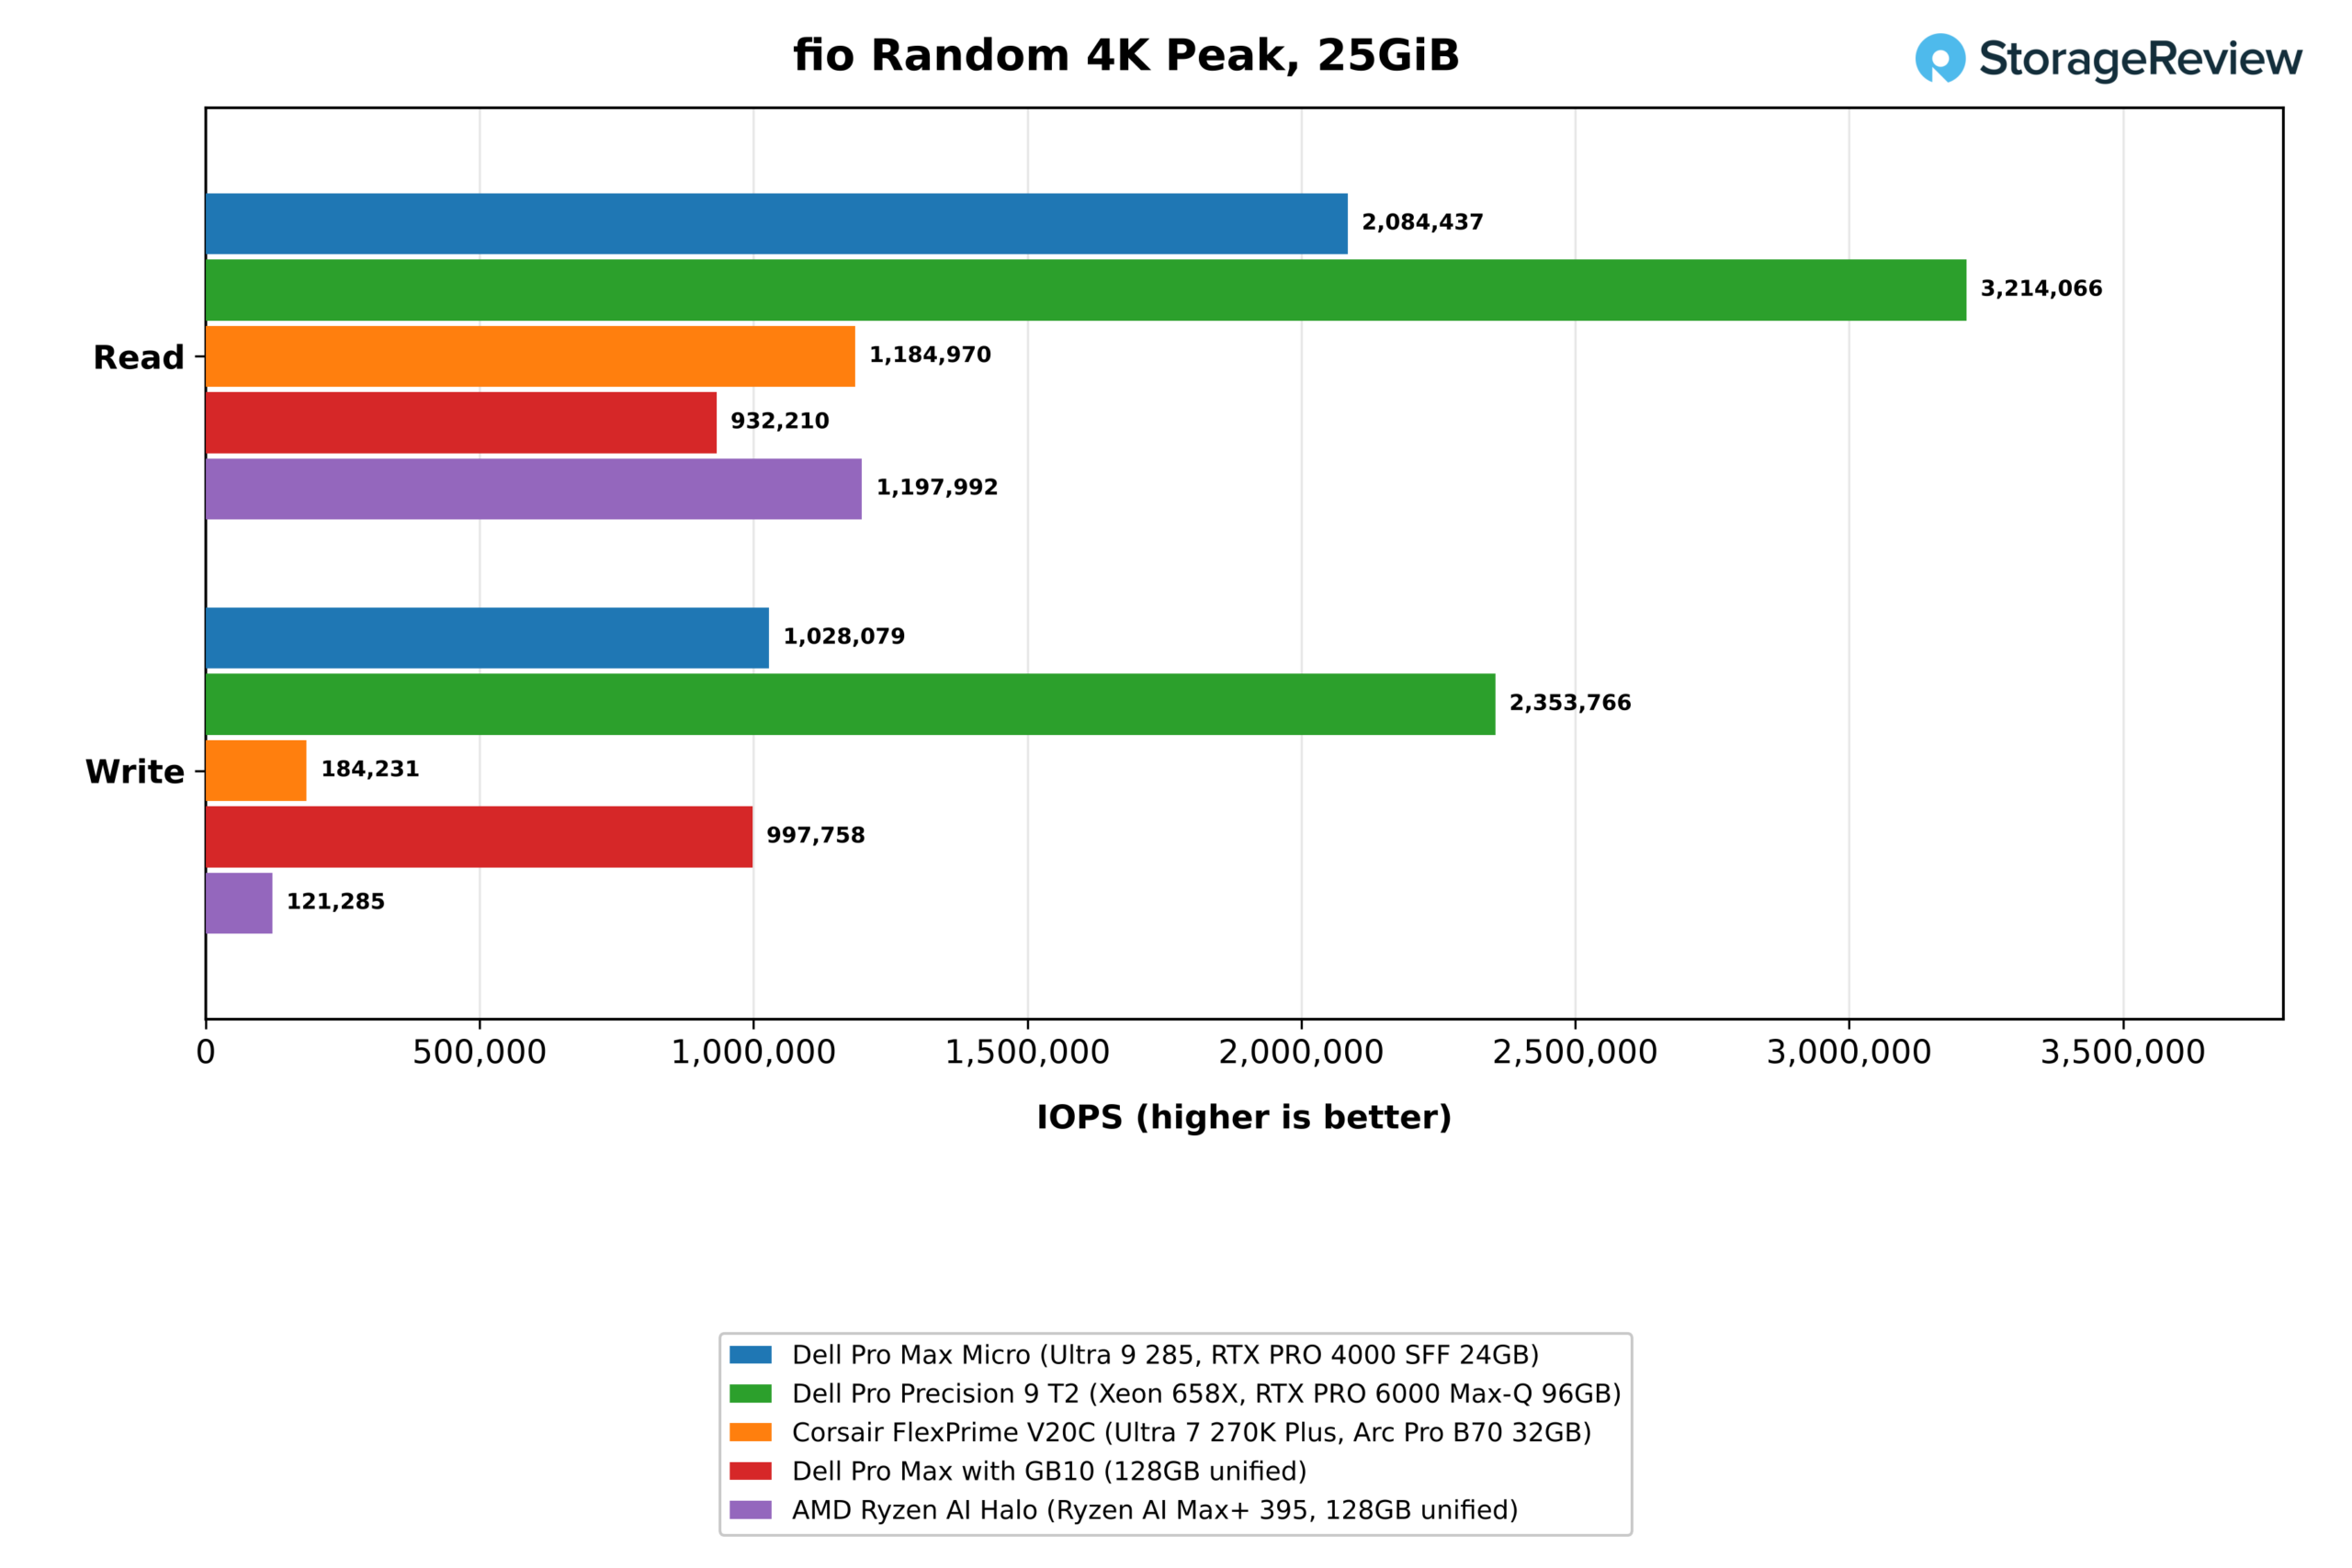
The lab’s Ubuntu install sits on one of the two 1TB Sandisk SN8050S drives, which links at PCIe Gen5 x4, so these results describe a single drive and exclude Dell’s RAID 0 configuration. It read at 9,433MB/s and wrote at 6,766MB/s, 29 percent ahead of the V20C’s drive in reads, 30 percent ahead of the Halo’s, and 36 percent ahead of the Gen4 drive in the GB10. The T2’s 20,914MB/s comes from a striped array of Gen5 drives. Peak 4K random read reached 2.08 million IOPS, against 3.21 million on the T2, 1.18 million on the V20C, 1.20 million on the Halo, and 932K on the GB10.
Random write peaked at 1.03 million IOPS, level with the GB10 at 998K, under half of the T2’s 2.35 million, and more than five times the V20C’s 184K and the Halo’s 121K, although the suite flagged the Micro’s and the Halo’s results for run-to-run variance after a rerun. The drive peaked at 63C under its heatsink. With a second 1TB drive already installed, a buyer can keep the striped volume for scratch space or split the drives into a boot disk and a model library, and Dell lists up to 8TB across the two slots.
Conclusion
The Dell Pro Max Micro puts a CUDA workstation in 2.9 liters, and that shows up wherever the software path is CUDA. In Ollama throughput and stable-diffusion.cpp image generation, it outran every system outside Dell’s line, ingesting RAG passages 27 percent faster than the GB10 and generating FLUX.2 images at 2.7 times the rate of a 32GB Arc Pro B70 on Vulkan and three times the rate of the Halo on ROCm. Its Gen5 drive was the fastest single SSD in the group, and the graphics card never passed 73C.
The limits are the 24GB ceiling and the heat. A 27B model at 4-bit quantization and Qwen-Image 20B did not fit, and the 285 ran at 98C to 105C in every all-core test. It trailed a tower with the same core layout by 17 to 26 percent across compression, rendering, and encoding. That tower compiled the Linux kernel in 30 percent less time, and the 16-core Halo was 32 percent faster in 7-Zip. The 128GB unified-memory desktops solved our OpenFOAM case in about half the time and hold models several times larger.
Inside Dell’s line, the Pro Precision 9 T2 shows what the next step buys: about three times the LLM serving rate, 3.5 times the image generation rate, 74 percent more 7-Zip throughput, and a 96GB card that loaded Qwen3.8 27B, Qwen-Image 20B, and gpt-oss 120B, none of which fit on the Micro. The Micro answers with faster individual cores, a footprint that is a fraction of the tower’s, and mounting options that put a workstation behind a display or under a desk.
Price is the other question for this configuration. At $11,999 as configured on Dell.com, our unit lists at three times the $3,999.99 that Corsair charges for the FlexPrime V20C and Micro Center charges for the AMD Ryzen AI Halo, and about 1.6 times the $7,521 Dell.com lists for a 128GB Pro Max with GB10 and a 1TB SSD. That buys the commercial package: ISV-certified RTX PRO graphics, vPro Enterprise, ECC memory options, and three years of onsite ProSupport. Organizations that need a managed, certified workstation in the smallest footprint are the buyers for this configuration, and teams choosing on tokens per dollar have other options.

Leaderboard: The Dell Pro Max Micro holds Best Mini Workstation with Discrete Graphics on our Best Desktop Workstations leaderboard.